Overview
This month’s release notes introduce new ways to bring data into Sift and view it across your tools. You can now send data from LabVIEW and FlexLogger directly to Sift. The Sift Grafana plugin is also now available in the public plugin catalog for easy installation. Sift’s workspace (Explore) now supports a logarithmic Y-axis scale, making it easier to inspect signals that span multiple orders of magnitude.New: Visualize Sift telemetry in Grafana via official plugin
- Overview: The Sift Grafana plugin is now publicly available in the Grafana plugin catalog. It supports both simple Channel queries and Calculated Channel expressions, enabling teams to visualize Sift telemetry directly in Grafana dashboards without any manual installation.
- Unlocked: With public catalog availability, teams no longer need to distribute or install the plugin manually. This update makes it easier to integrate Sift into existing dashboards and observability workflows, while continuing to pull structured telemetry from Sift’s Single Source of Truth (SSOT) with full consistency and governance.
New: Send data to Sift from LabVIEW and FlexLogger
- Overview: Sift now offers official plugins for LabVIEW and FlexLogger, enabling teams to send or upload engineering data from National Instruments environments directly into Sift for centralized analysis and observability.
- Unlocked: Engineers can now send or upload data from LabVIEW and FlexLogger into Sift to unify telemetry from test and validation workflows. This closes the gap between data collection and analysis, making results easier to visualize, review, and trace all within a single platform.
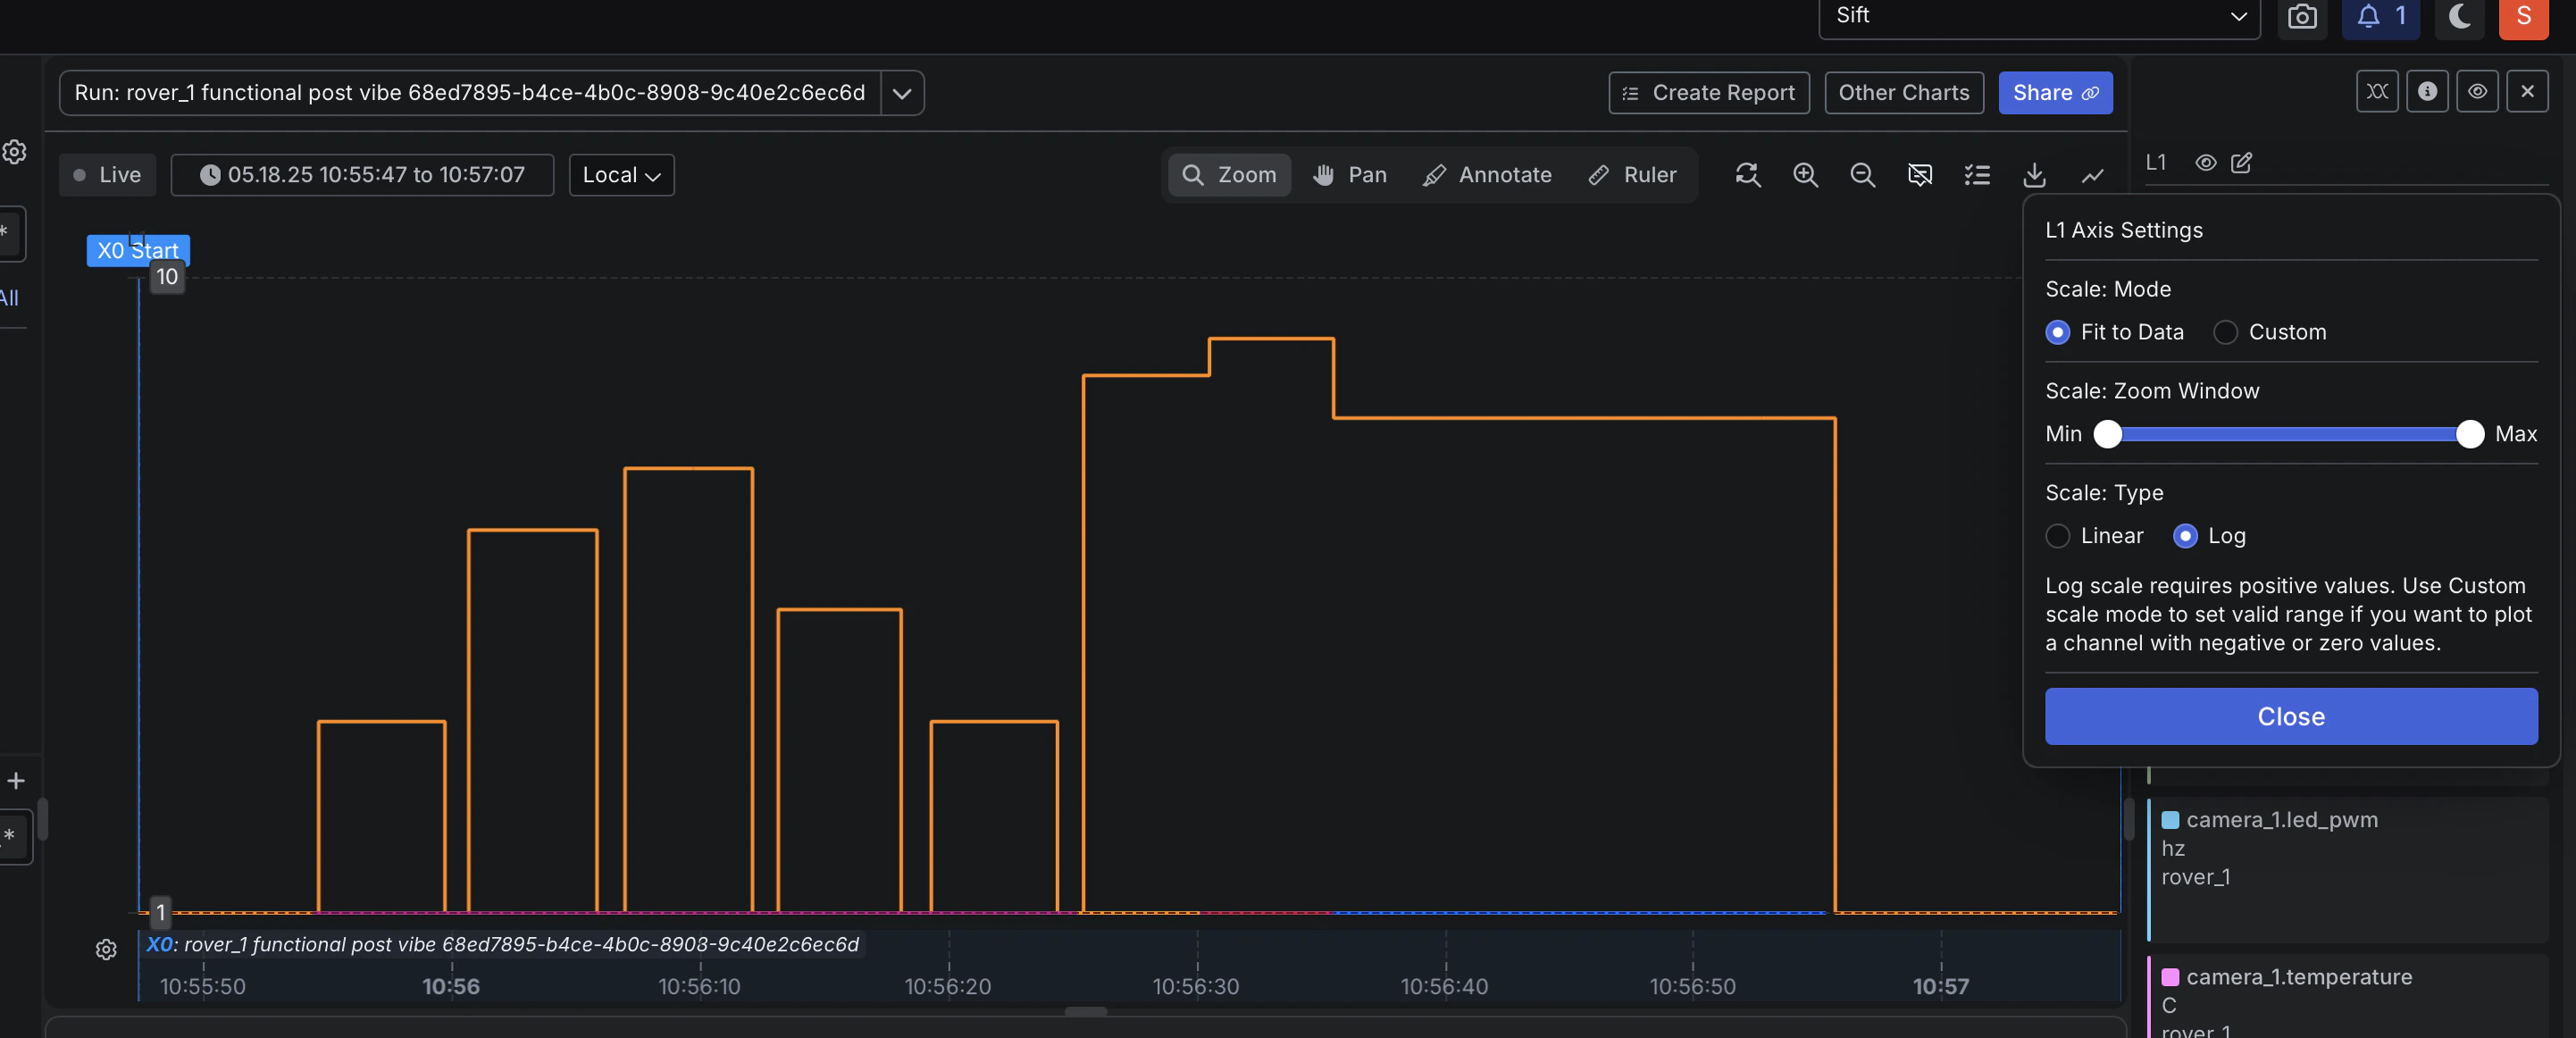
New: Log scale to view signals across multiple magnitudes
- Overview: Explore now supports a logarithmic Y-axis scale, giving users a clearer view of signals (Channels) that span multiple orders of magnitude.
- Unlocked: Log scale helps surface patterns and trends in high-dynamic-range data that might be flattened or hidden on a linear scale.