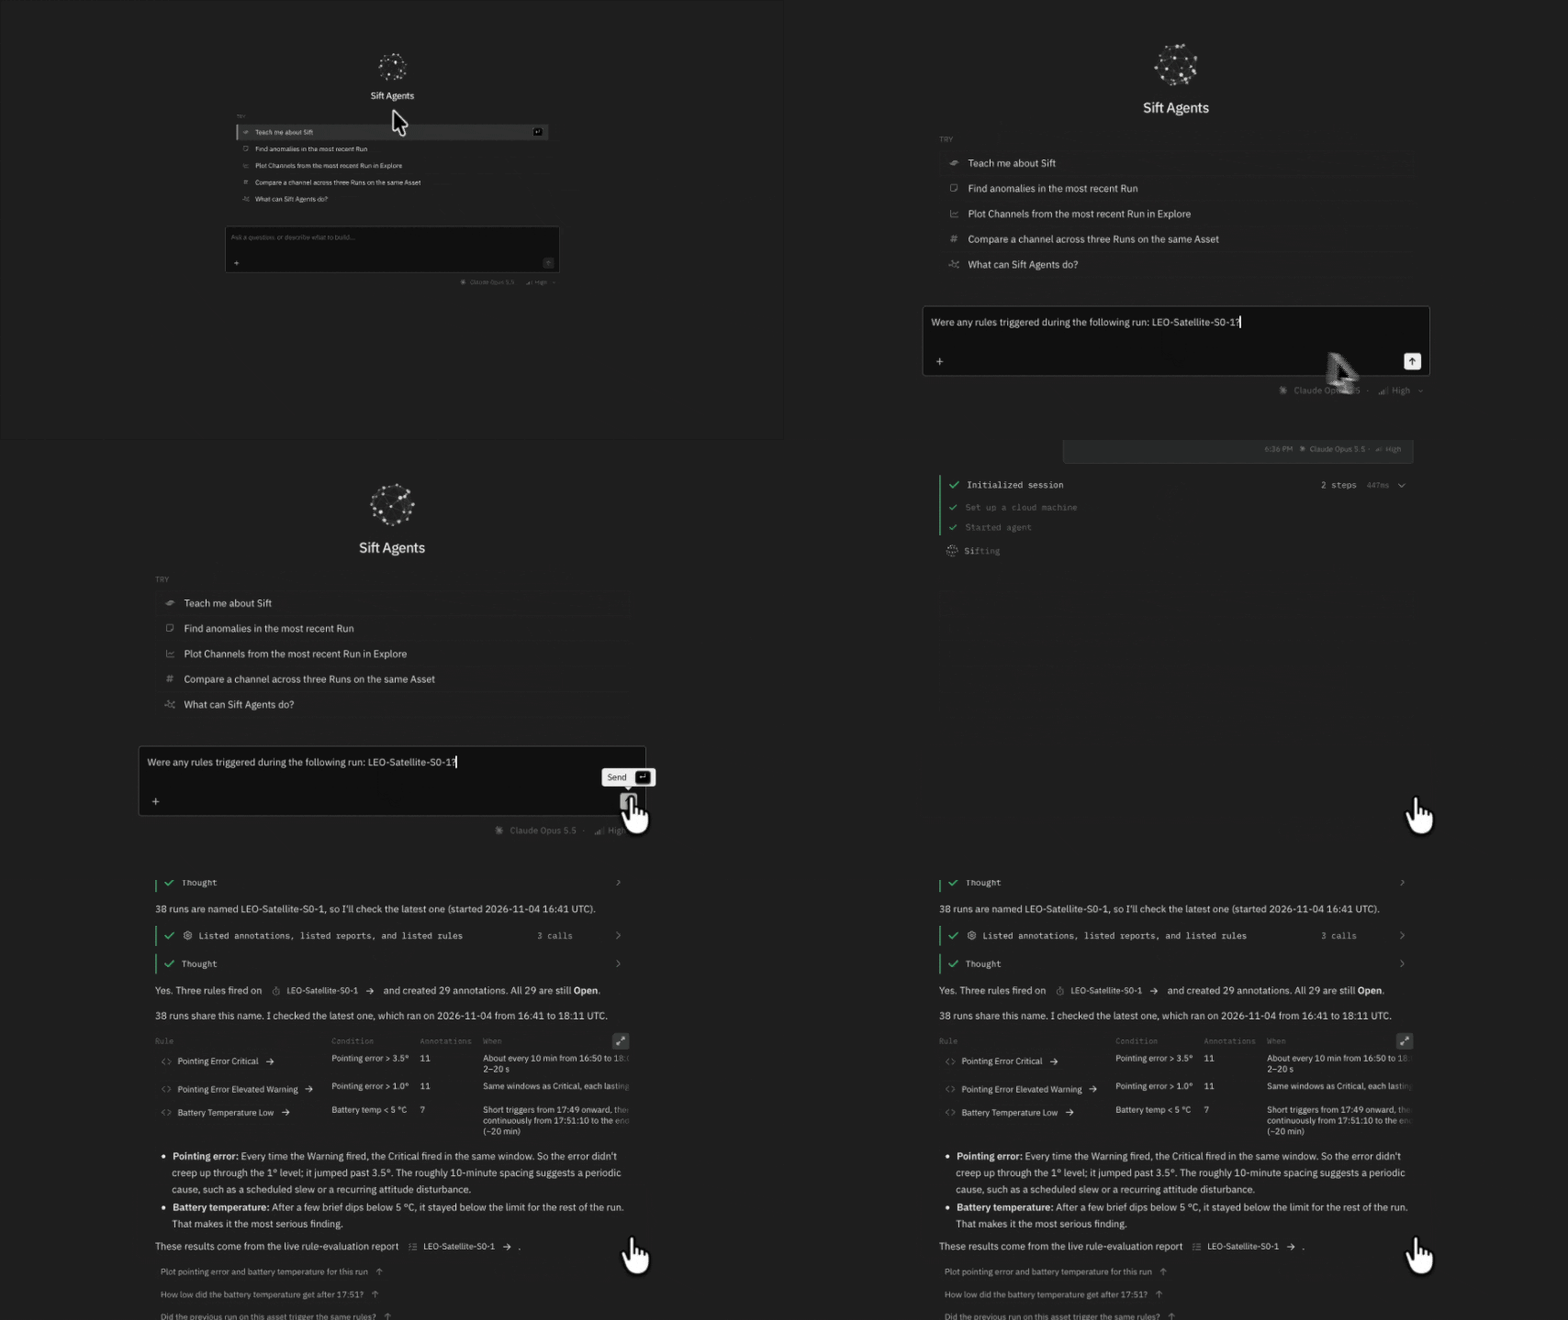
Investigate telemetry with a hosted AI agent
Ask questions about your hardware telemetry with Sift Agents. Review its evidence and approve each proposed change before it reaches your workspace.- Compare possible causes with Python and SQL.
- Save and share the full investigation.
- Turn approved findings into Rules or Calculated Channels.
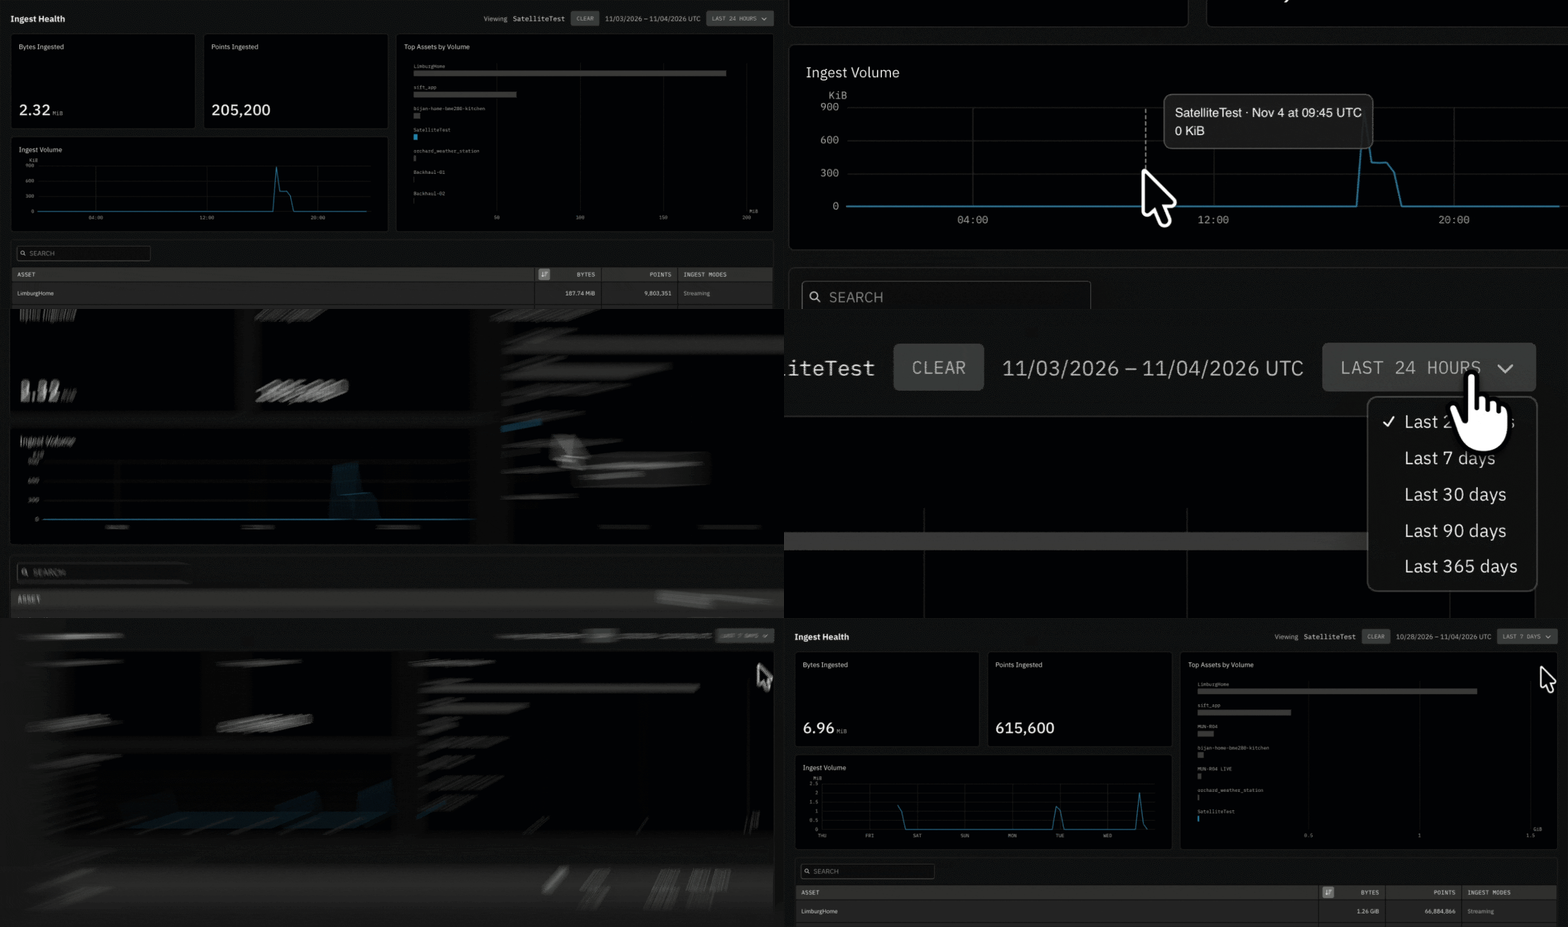
Verify that your data is arriving
Confirm how much data reaches Sift with the Ingest Health dashboard, an organization-level view of ingest volume in bytes and points.- Spot unexpected drops or spikes in ingest volume over periods from the last 24 hours to the last 365 days.
- Rank Assets by bytes to see which sends the most data.
- Select an Asset to scope the dashboard to it.
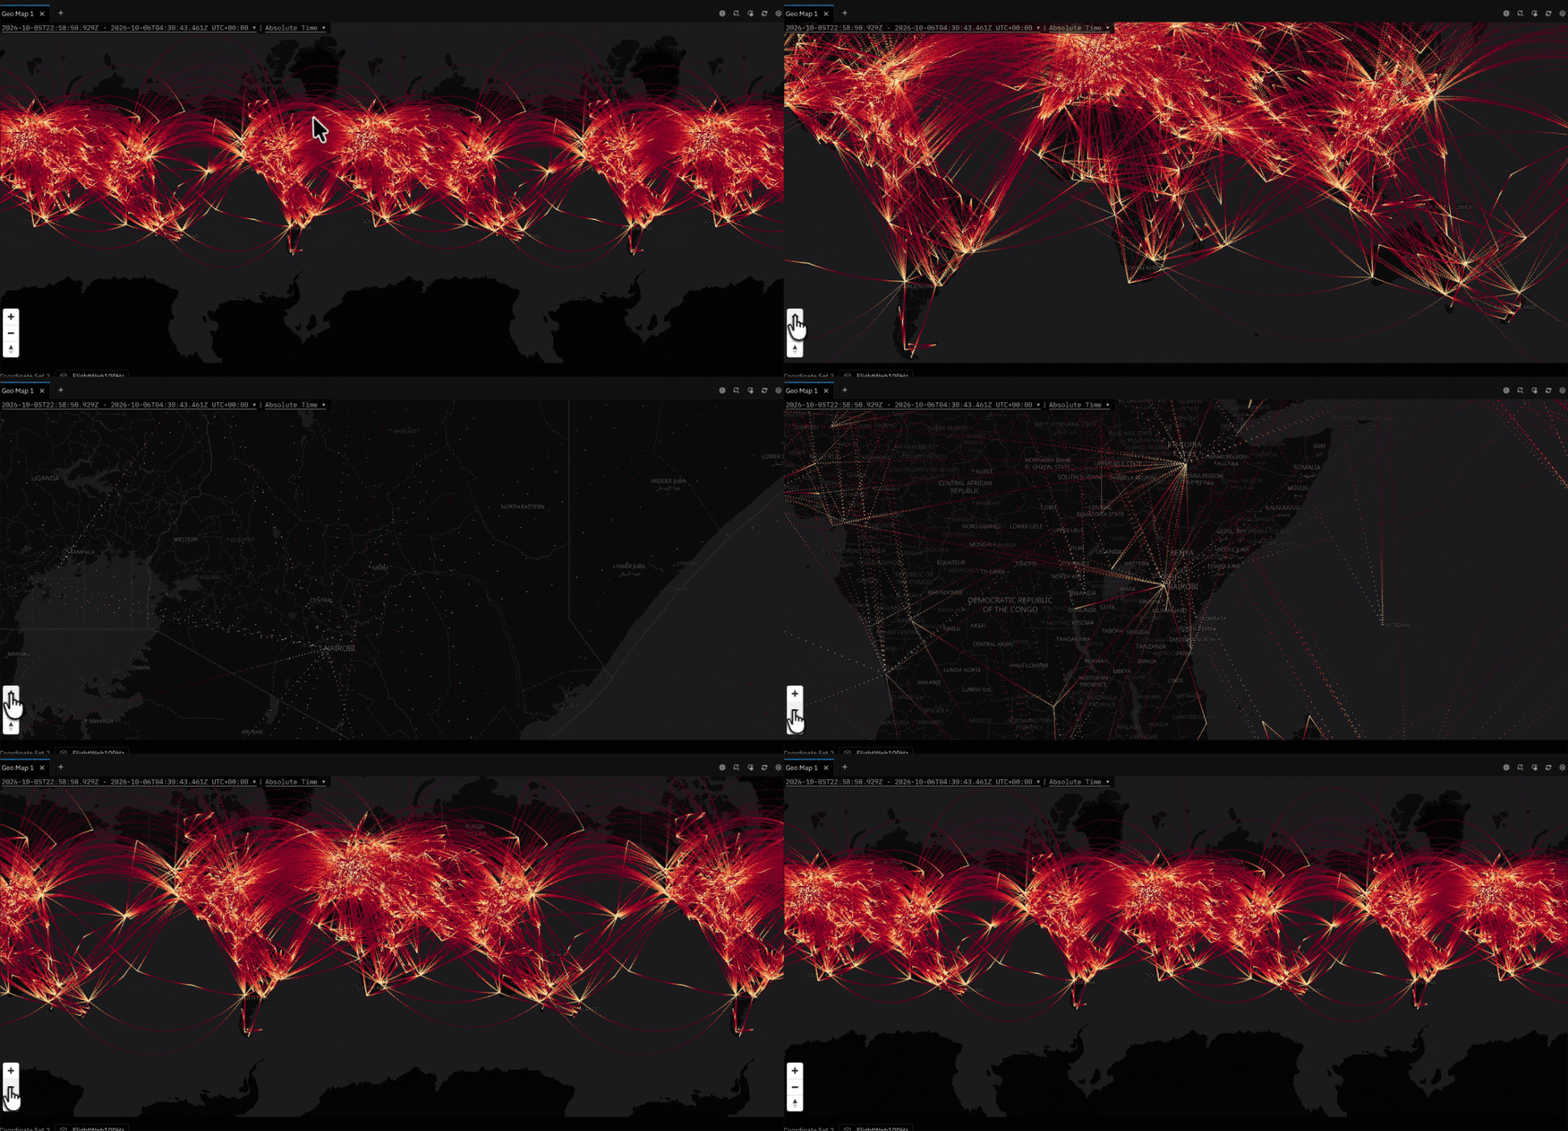
Plot large location datasets without slowing down
Visualize large geographic datasets in Explore with faster, more responsive Geo Map Panels.- Plot up to 1 million points per coordinate set, depending on device performance.
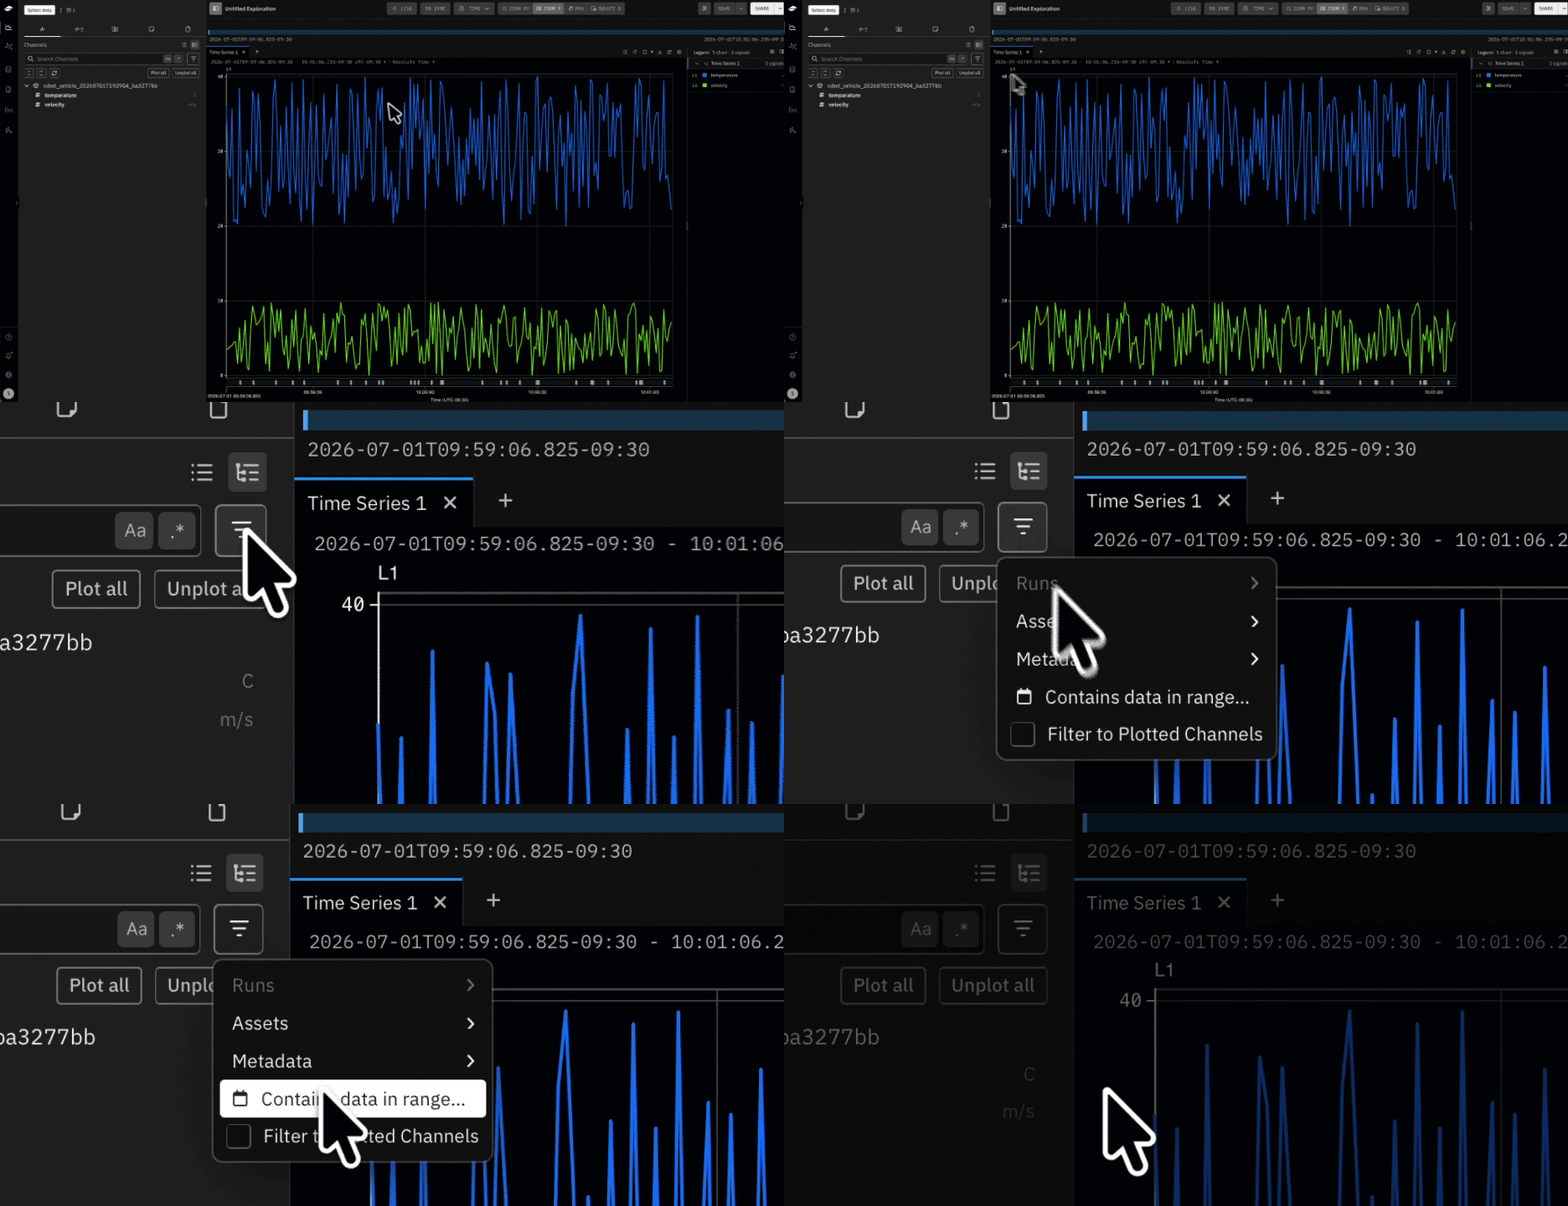
View only the Channels with data in a date range
Narrow the Channel list in Explore to Channels that contain data in a UTC date range with time-based Channel list filtering.- Combine the date range with text search and metadata filters.
- Filter large Assets across up to 30 UTC days and Runs across their full duration.
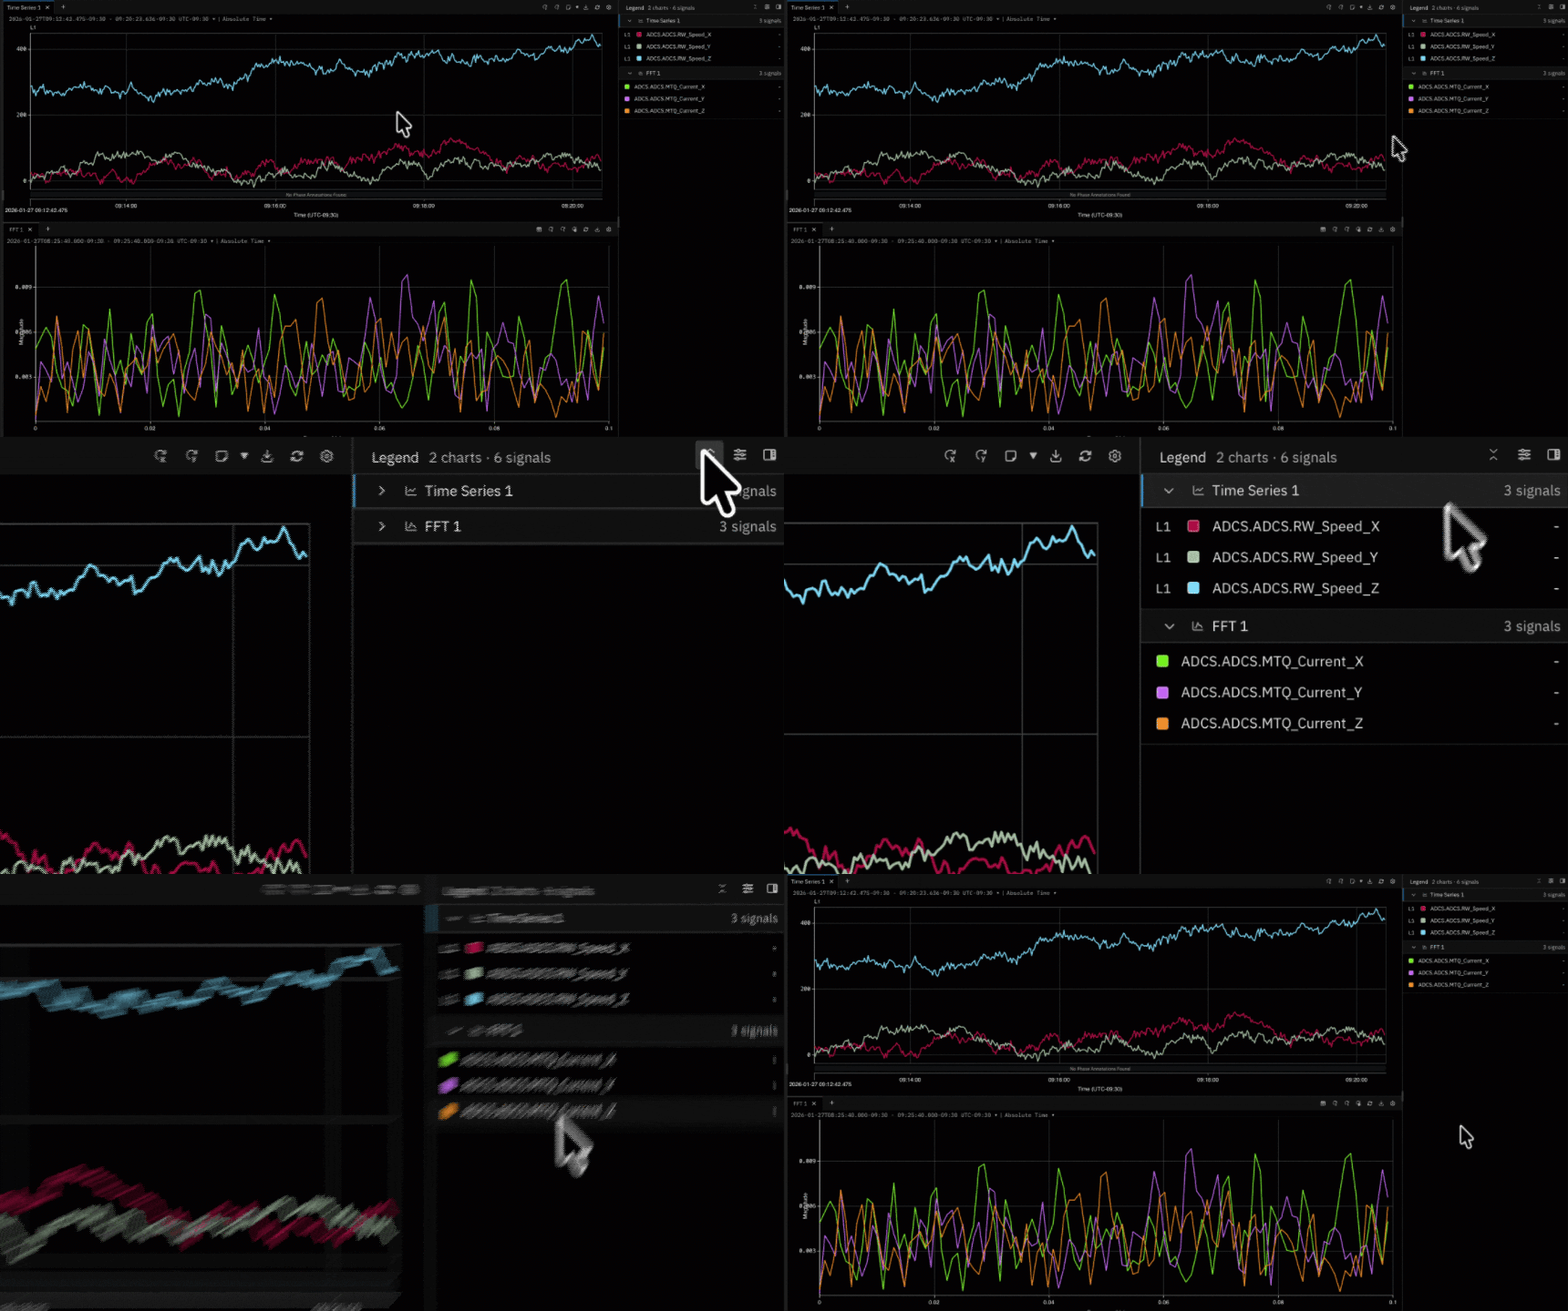
Give your Explore Panels more room with Global Legend
Consolidate Panel legends into a single sidebar instead of displaying them within each individual Panel.- View legends for all Time Series and FFT Panels in a single sidebar.
- Free up space in multi-Panel layouts.