Overview
In this tutorial, you’ll learn how to organize and explore telemetry data using Explore v1.Prerequisites
- Download the rover.csv file.
Step 1: Import data
- In Sift, click .
- Click Import data.
- Upload the rover.csv file.
- Click New Asset.
- In the Asset box, enter:
- In the Run box (New), edit the Run name with the following:
- Click Upload.
- Click Close
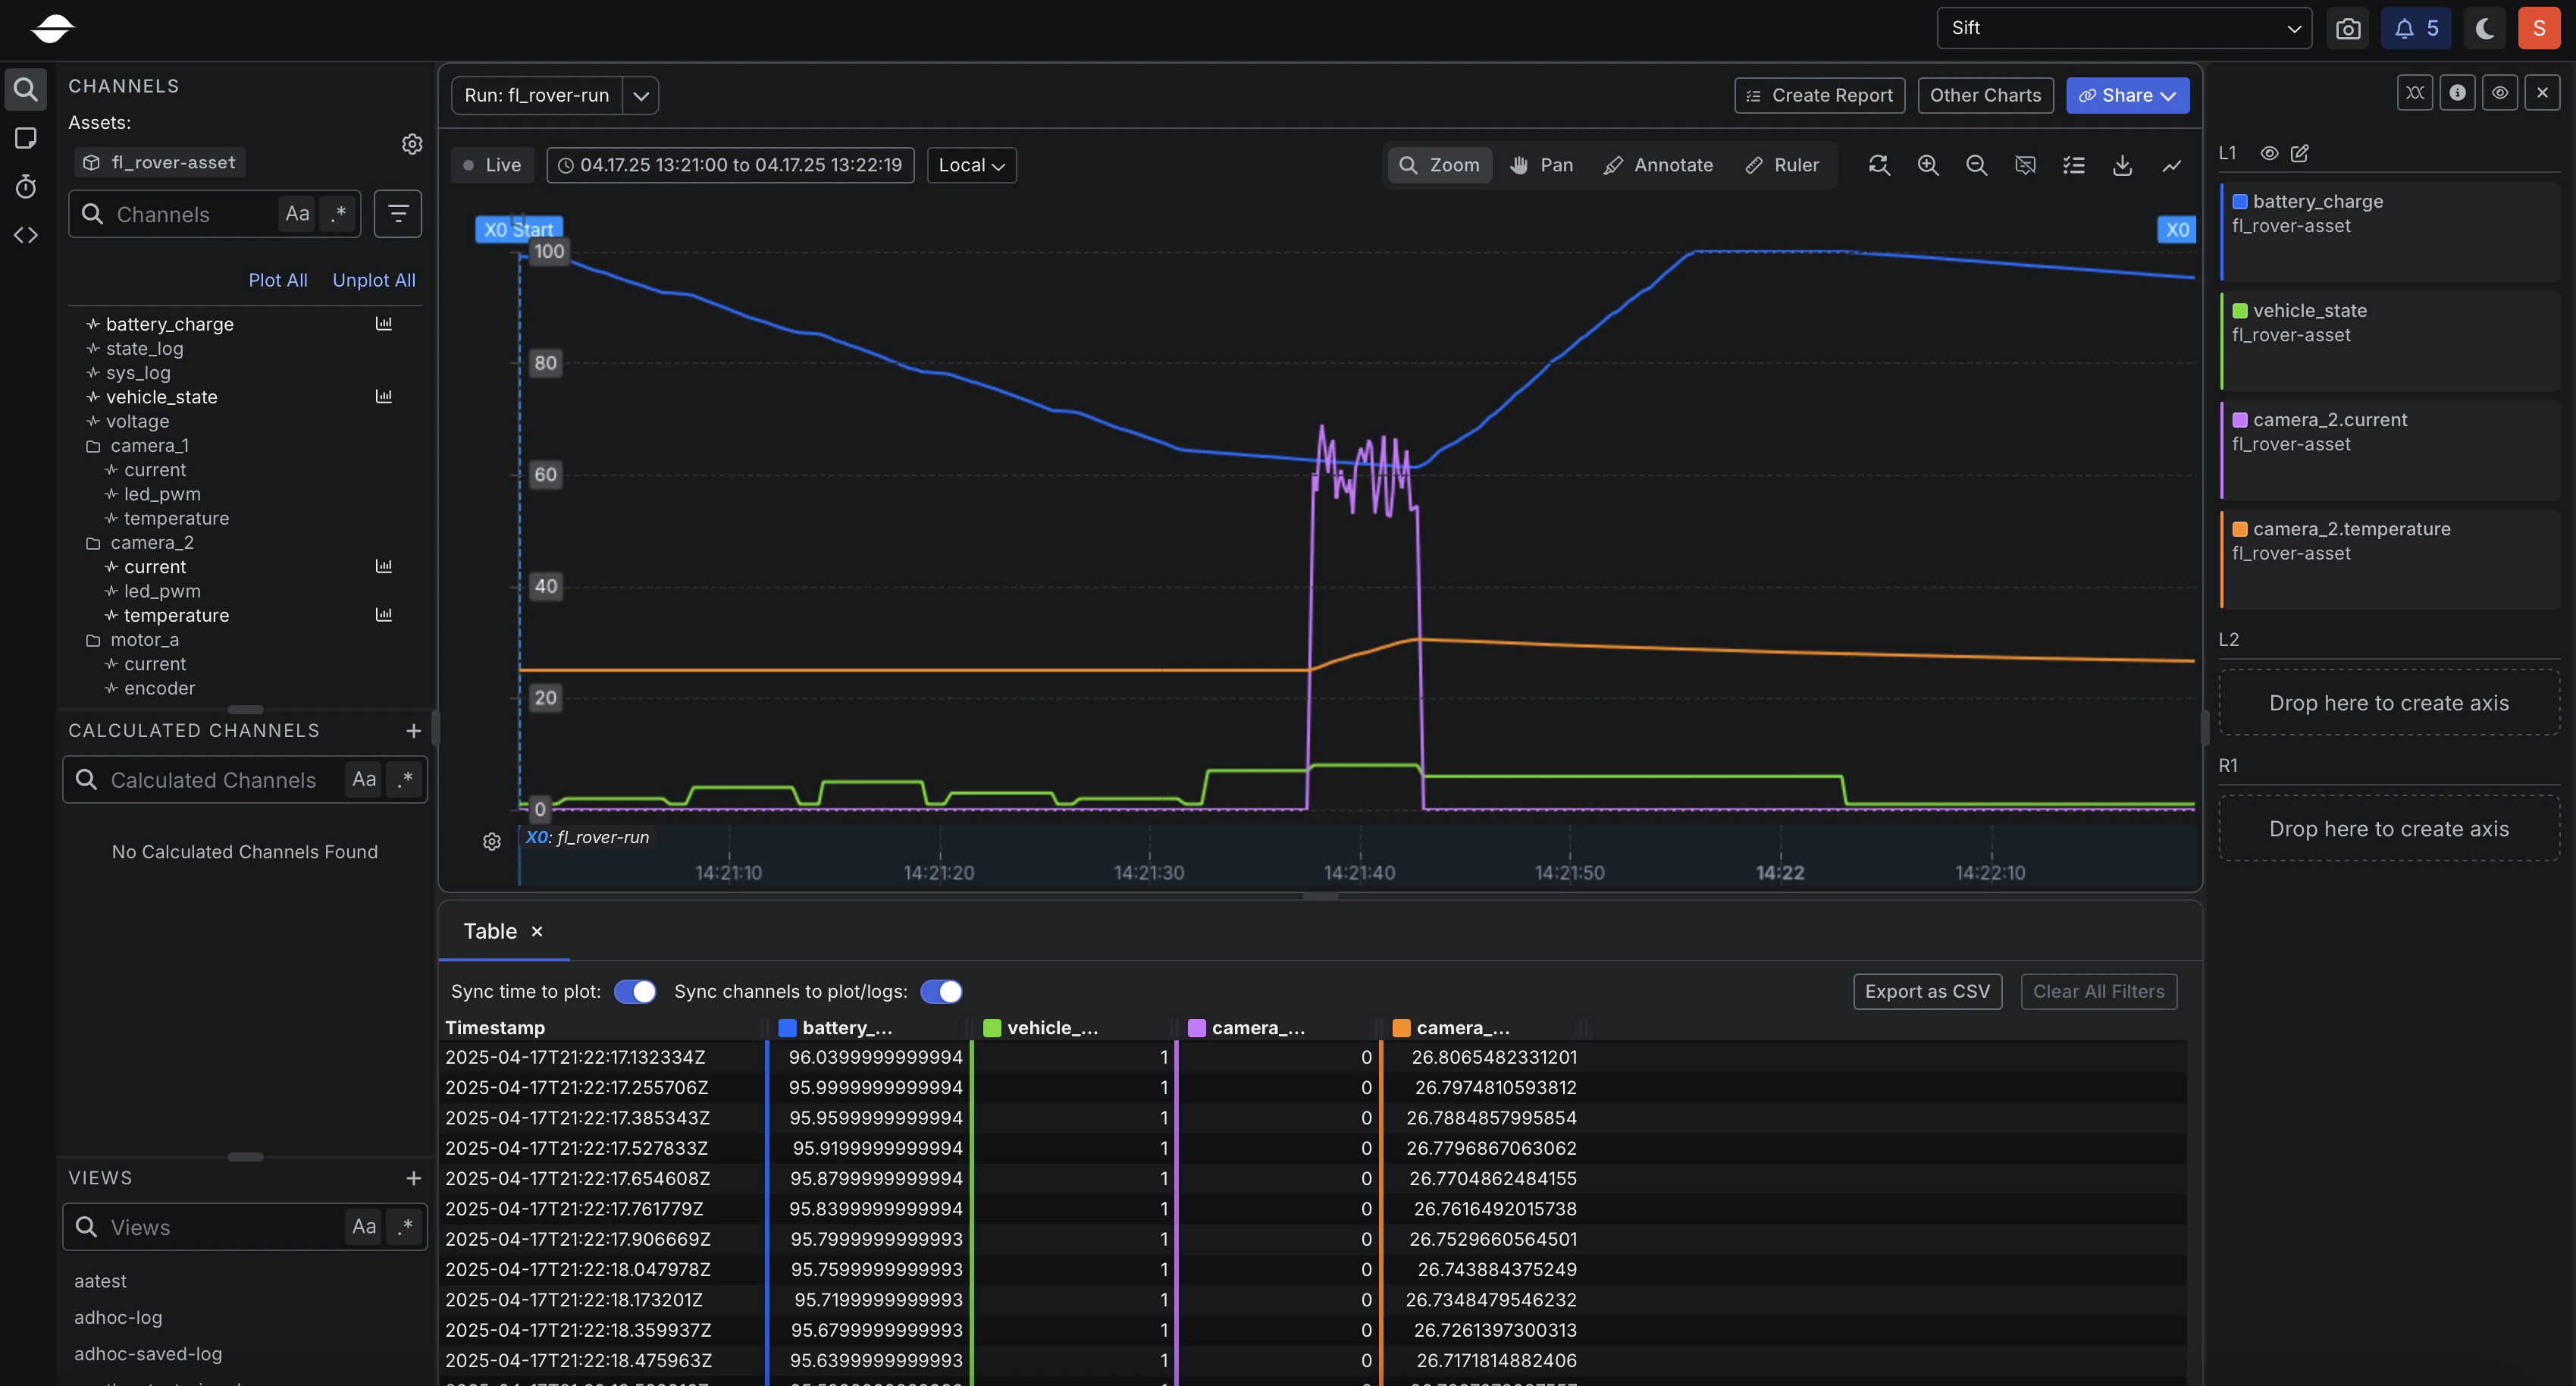
Step 2: Plot data
- In the Runs name or description box, enter the following:
- In the Runs table, click fl_rover-run.
- Click Explore Legacy.
- In the Channels section, click the following Channels:
- battery_charge
- vehicle_state
- Click Other charts.
- Select Table Viewer.
- In the Channels section, under camera_2, click the following Channels:
- current
- temperature