Tutorial 1: Get started with Sift by building your first telemetry workflow
Overview
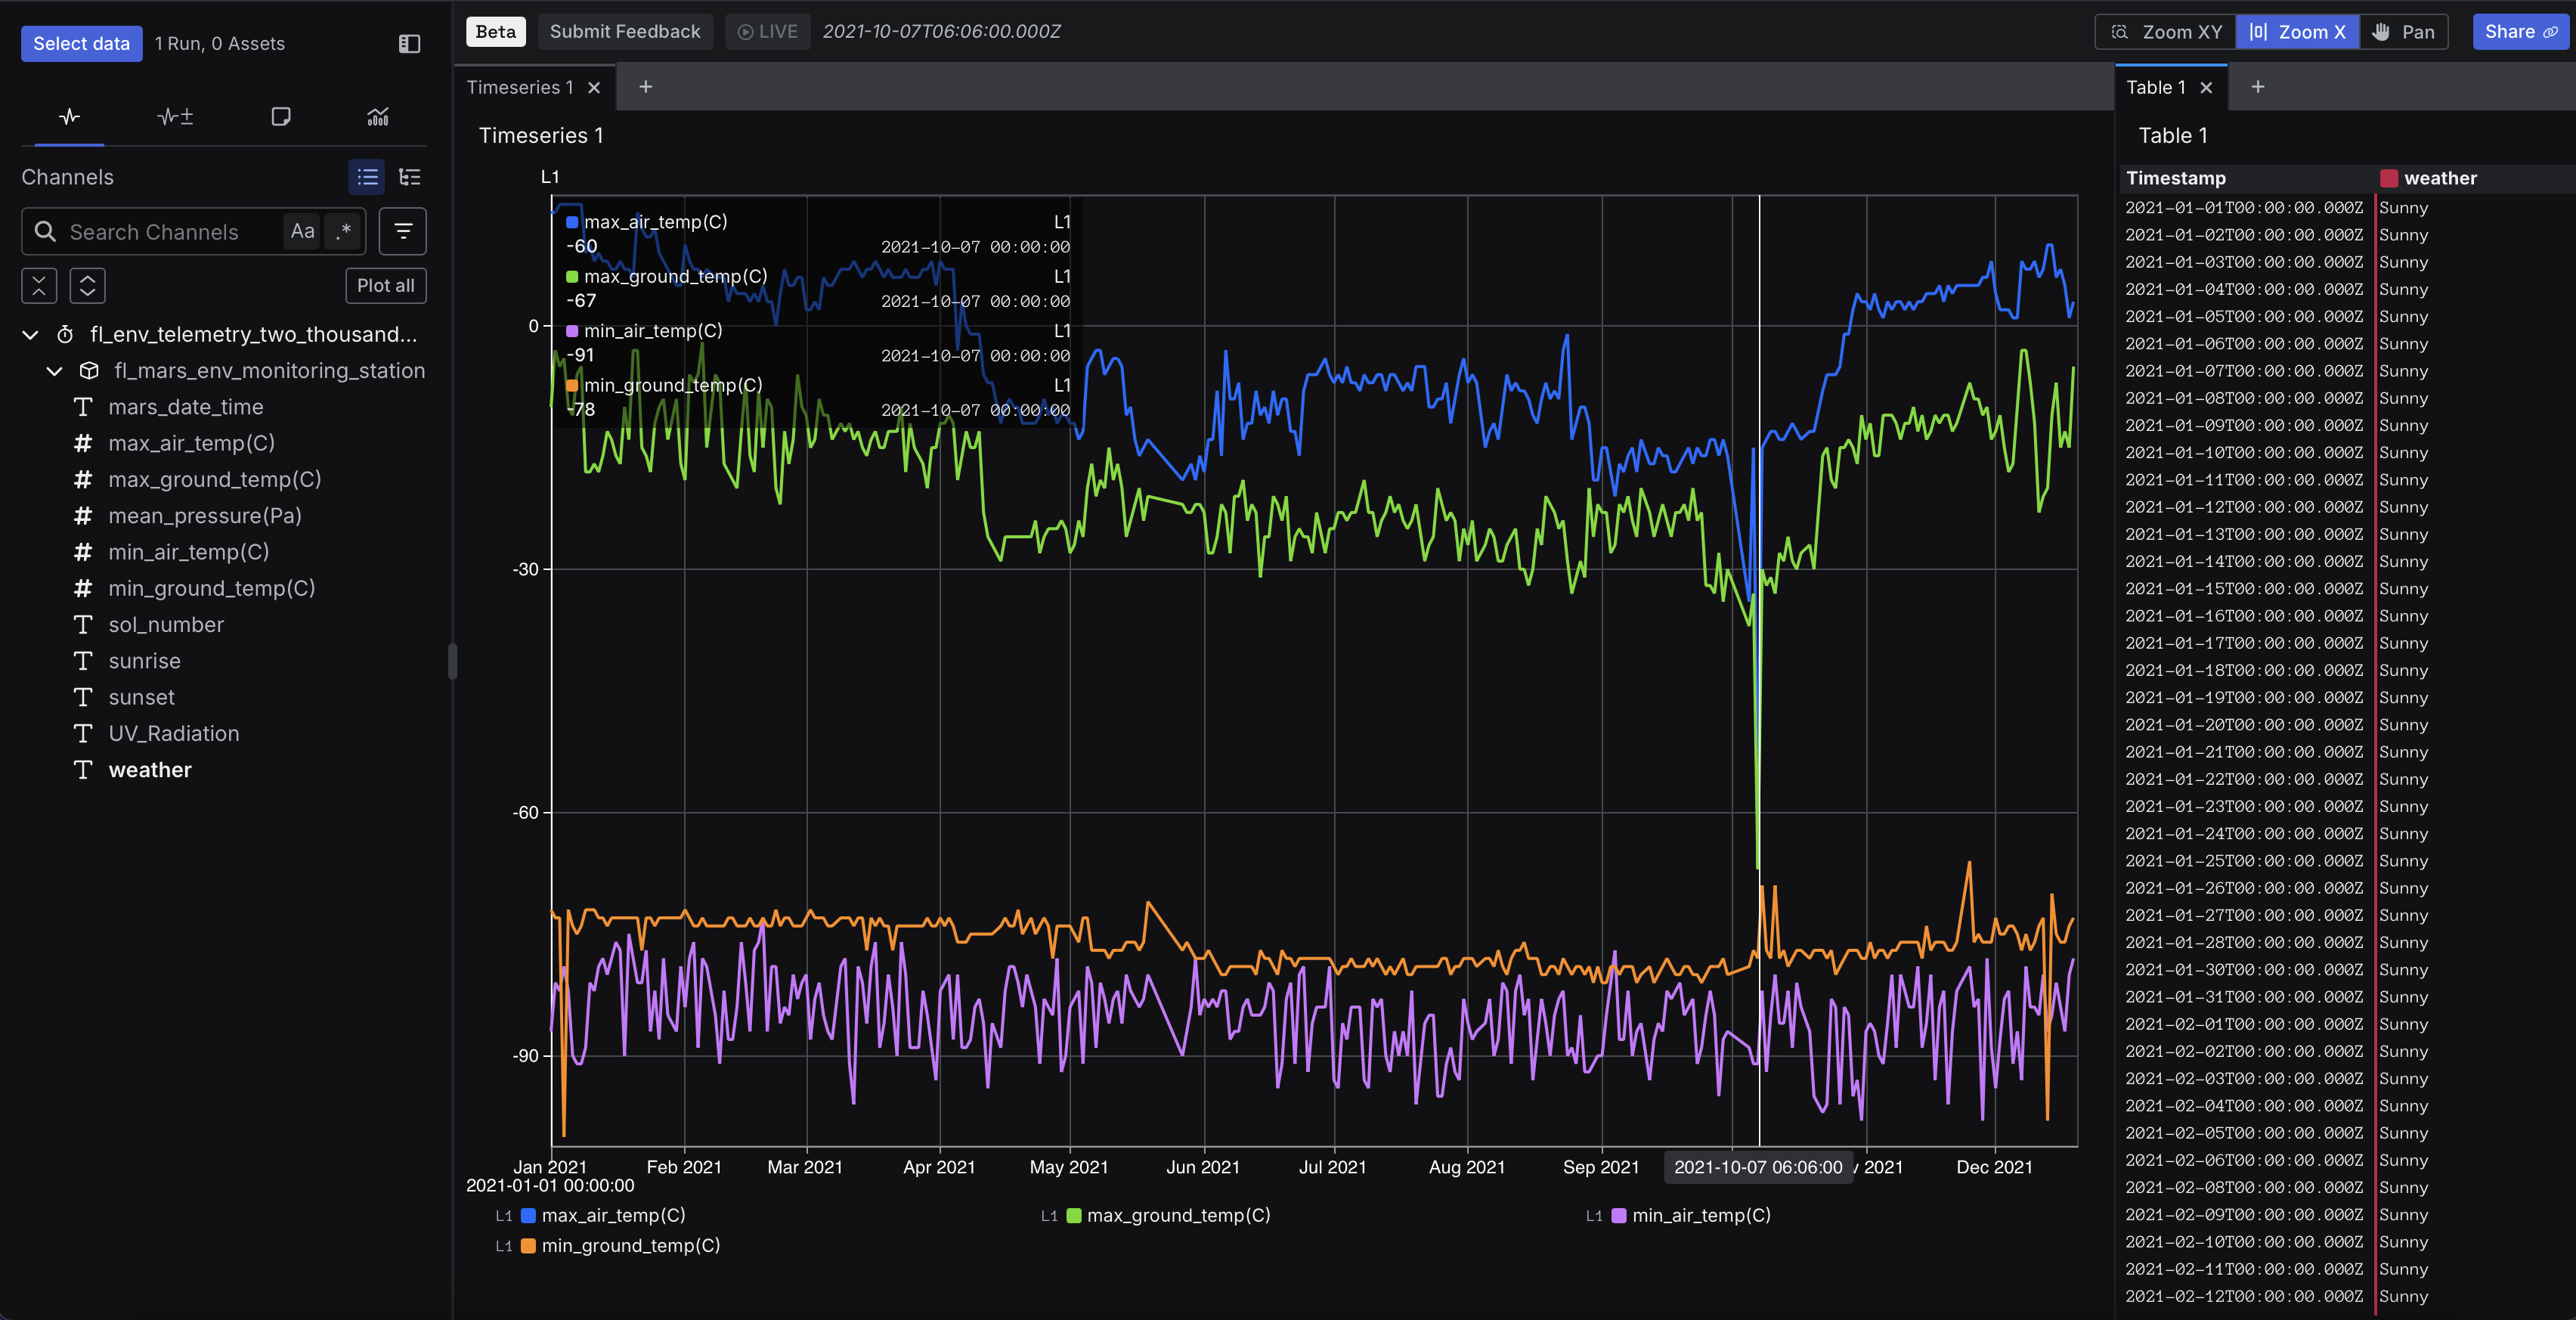
This tutorial introduces Sift through a hands-on, end-to-end workflow using real-world telemetry. You will work with a preprocessed dataset from the Mars Environmental Monitoring Station (REMS), an instrument package aboard NASA’s Curiosity rover. The preprocessed dataset contains one year of environmental sensor readings collected on the Martian surface, including temperature, pressure, and ultraviolet radiation levels.
You will begin by importing and visualizing the dataset to explore environmental patterns and spot potential anomalies. After identifying a sharp temperature drop, you’ll define a condition to automatically detect similar behavior in the future. You’ll then create a summary view that highlights when and where this condition occurs across the dataset. Finally, you’ll generate a new signal by combining temperature readings, making it easier to track changes over time. This mirrors a typical hardware telemetry workflow: importing and exploring data, identifying patterns, automating checks, and extracting insights for review and analysis.
Prerequisites
- Preprocessed dataset: env_telemetry_two_thousand_twenty_one.csv
- Access to Sift (either the Public Cloud or GovCloud deployment)
Preprocessed dataset
| earth_date_time | mars_date_time | sol_number | max_ground_temp(C) | min_ground_temp(C) | max_air_temp(C) | min_air_temp(C) | mean_pressure(Pa) | sunrise | sunset | UV_Radiation | weather |
|---|---|---|---|---|---|---|---|---|---|---|---|
| 2021-12-20T00:00:00Z | Mars, Month 5 - LS 144 | Sol 3332 | -6 | -73 | 7 | -80 | 703 | 05:33 | 17:23 | moderate | Sunny |