> ## Documentation Index
> Fetch the complete documentation index at: https://docs.siftstack.com/llms.txt
> Use this file to discover all available pages before exploring further.
# Getting started with Explore (legacy)
> Learn how to work with Explore (legacy)
export const SiftIcon = ({className}) => ;
## Overview
In this tutorial, you'll learn how to organize and explore telemetry data using Explore v1.
## Prerequisites
* Download the [rover.csv](https://drive.google.com/file/d/1_8MXmOcT2vLh1zXE6uThX-bYytN4XGBS/view?usp=sharing) file.
## Step 1: Import data
1. In **Sift**, click .
2. Click **Import data**.
3. Upload the **rover.csv** file.
4. Click **New Asset**.
5. In the **Asset** box, enter:
```
fl_rover-asset
```
Replace `fl` with your initials (first and last name). This helps avoid naming conflicts if others are also completing the tutorial on the same Sift instance.
6. In the **Run** box (New), edit the Run name with the following:
```
fl_rover-run
```
Again, replace `fl` with your initials to ensure the Run name is unique within your workspace.
7. Click **Upload**.
8. Click **Close**
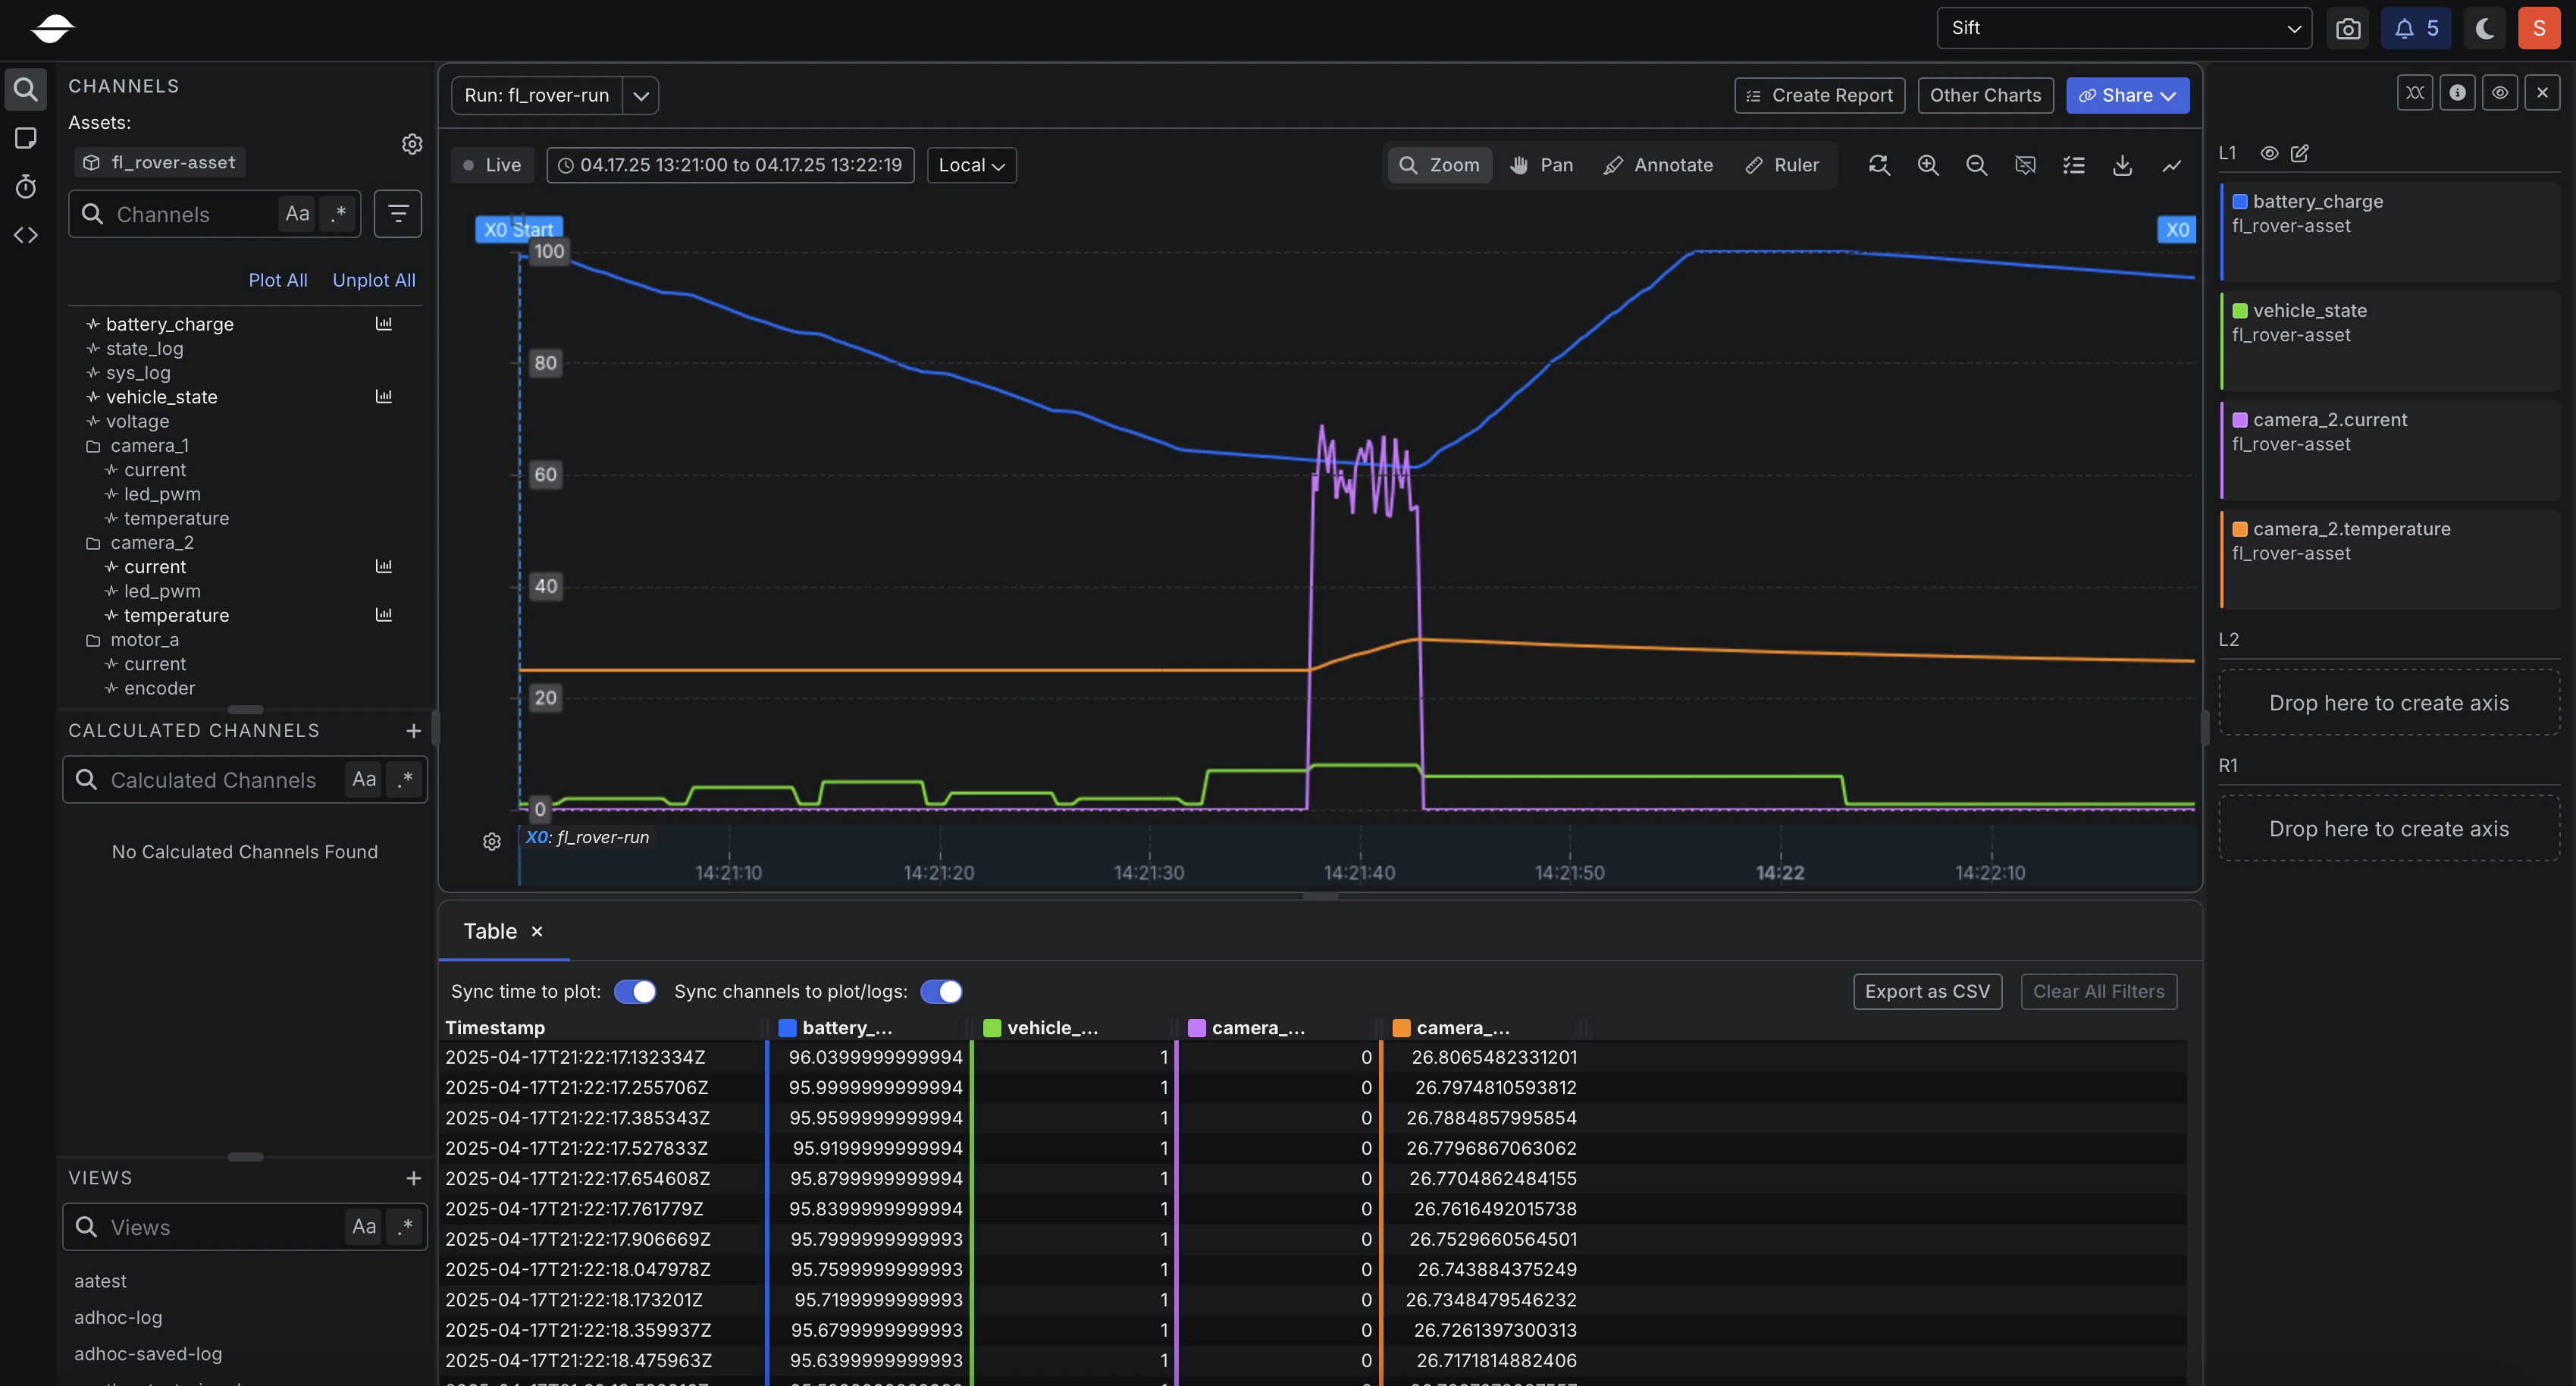
## Step 2: Plot data
1. In the **Runs name or description** box, enter the following:
```
fl_rover-run
```
2. In the **Runs** table, click **fl\_rover-run**.
3. Click **Explore Legacy**.
4. In the **Channels** section, click the following Channels:
* **battery\_charge**
* **vehicle\_state**
5. Click **Other charts**.
6. Select **Table Viewer**.
7. In the **Channels** section, under **camera\_2**, click the following Channels:
* **current**
* **temperature**
## Conclusion
In this tutorial, you learned how to organize and explore telemetry data using Explore v1.
 ## Conclusion
In this tutorial, you learned how to organize and explore telemetry data using Explore v1.
## Conclusion
In this tutorial, you learned how to organize and explore telemetry data using Explore v1.