> ## Documentation Index
> Fetch the complete documentation index at: https://docs.siftstack.com/llms.txt
> Use this file to discover all available pages before exploring further.
# Analyze with agents, keep tests visible, and follow every state
> Release notes · September 2026
This release connects your coding agent to Sift for ingestion, investigation, and approved write actions. It also keeps telemetry visible beside the hardware through network drops so you can move the Runs you choose into Sift when you're ready. You can also follow state changes, read current values, and mark important moments directly in Explore.
## Analyze telemetry from your coding agent
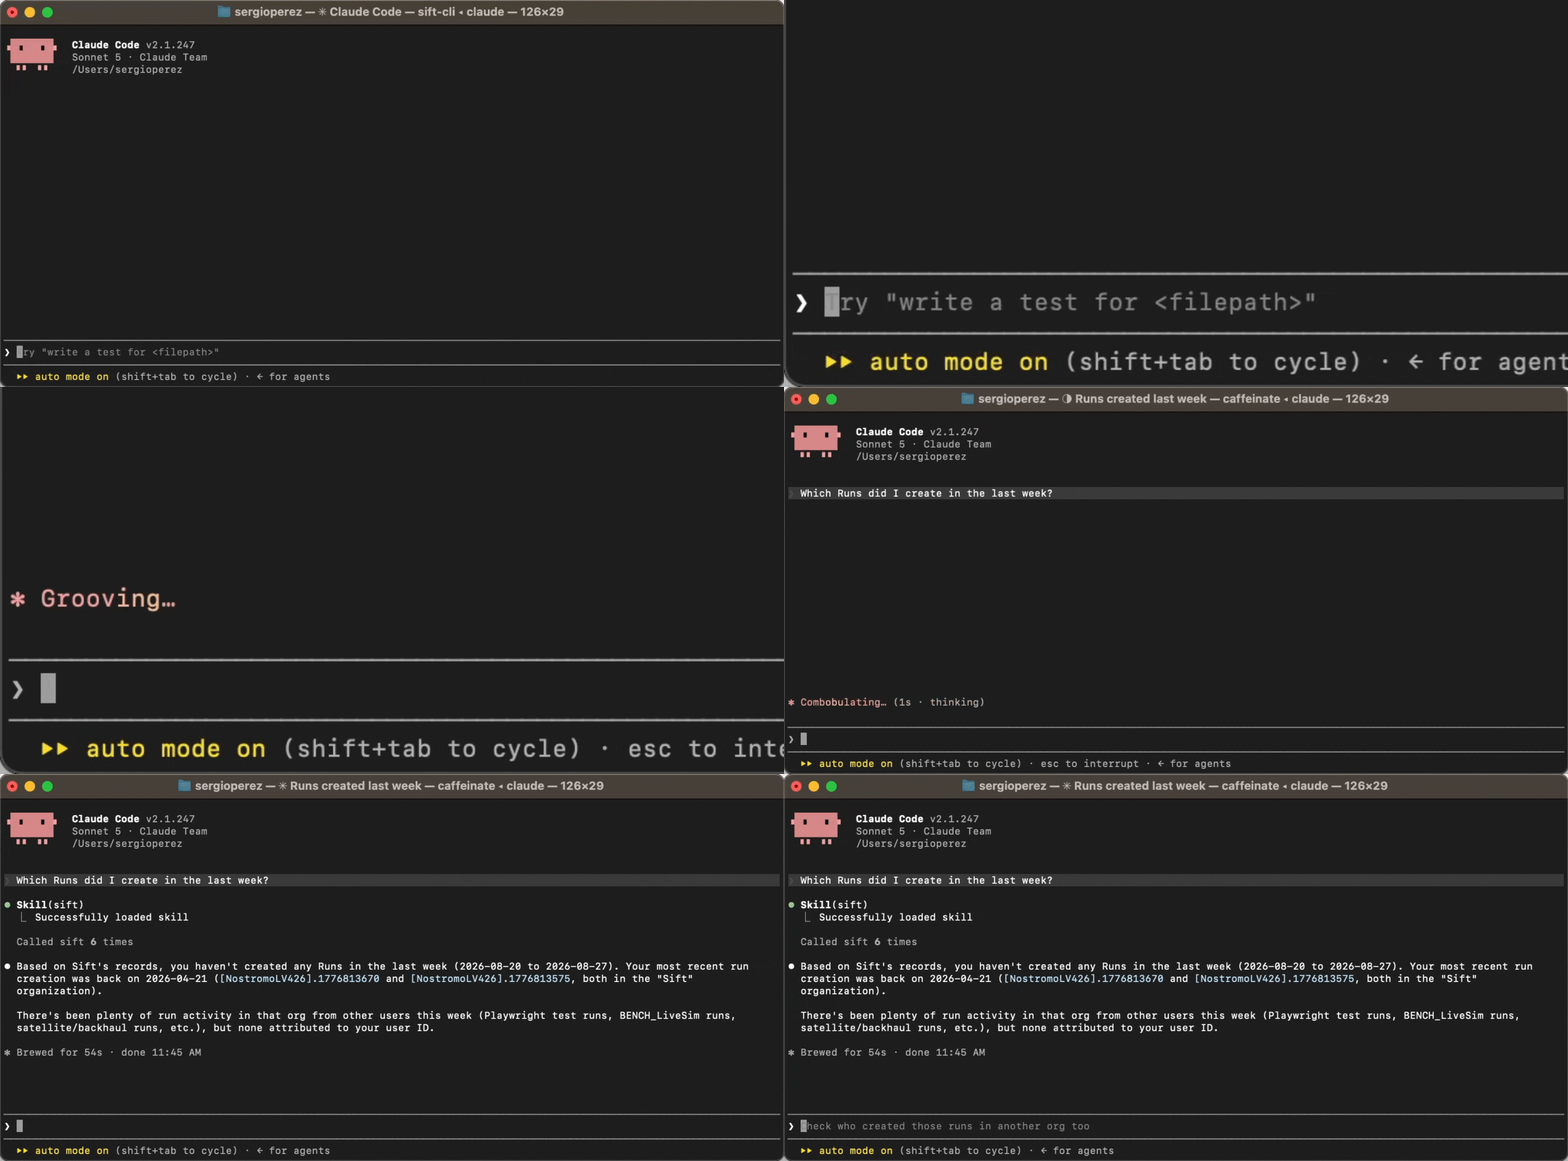
Connect Claude Code, Codex, Cursor, or OpenCode to your Sift environment with the [Sift MCP](/documentation/cli/sift-mcp) server. Ask your agent to ingest and discover telemetry, run analyses and transformations, or create Sift resources from the interface you already use.
* Install skills and register the Model Context Protocol (MCP) server with supported clients using a single Sift CLI command.
* Keep tools that overwrite or archive existing disabled resources until you choose to enable them.
* Protect sessions with context limits, filtered queries, and automatic retry backoff.
 ## Keep test telemetry visible through network drops
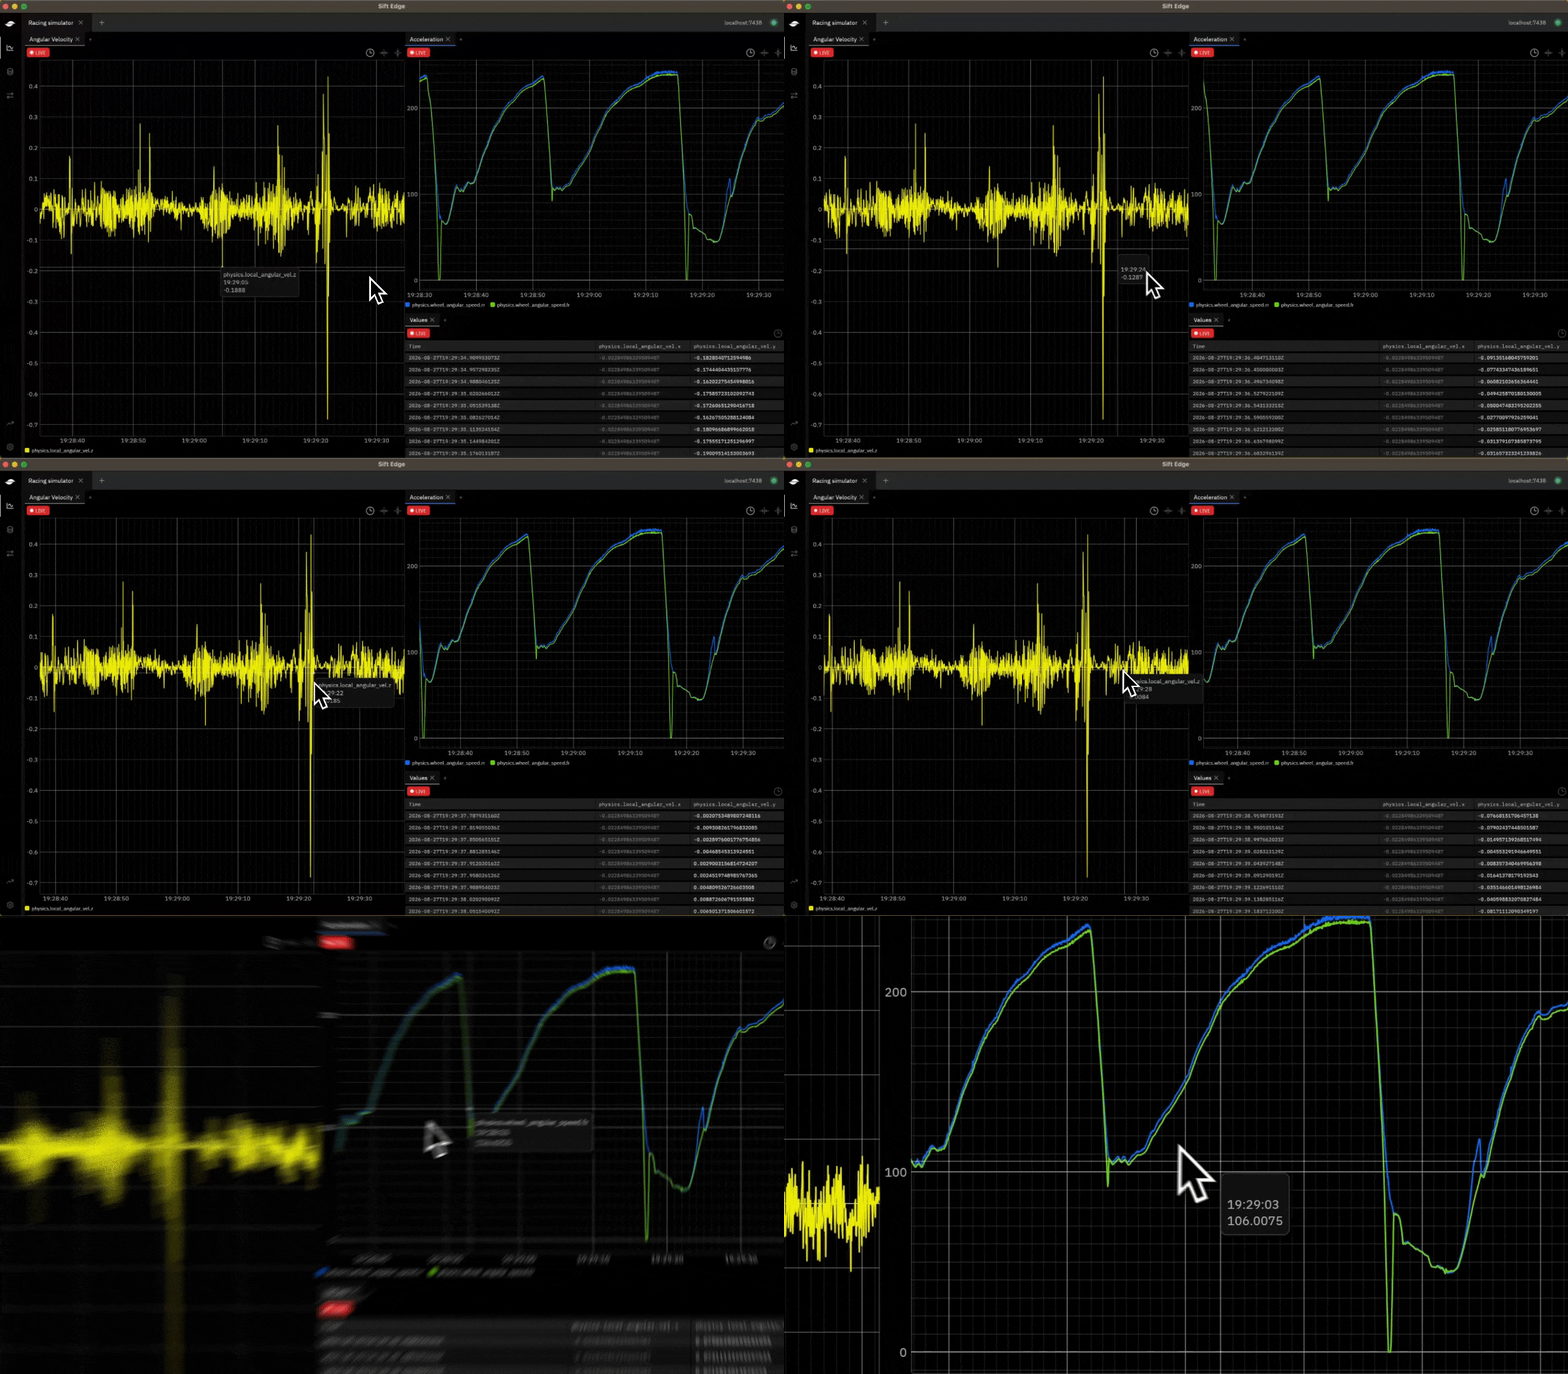
Capture and inspect telemetry beside your hardware with [Sift Edge](https://www.siftstack.com/use-case/sift-edge). Your Runs are saved locally during an interruption, letting you upload the ones you choose to Sift once your connection returns.
* Watch live and recent telemetry with low latency from a local desktop app.
* Translate protocols on site, buffer telemetry, and replay it after reconnecting.
* Continue the analysis in Sift beside your Rules, Reports, saved views, and Run history.
## Keep test telemetry visible through network drops
Capture and inspect telemetry beside your hardware with [Sift Edge](https://www.siftstack.com/use-case/sift-edge). Your Runs are saved locally during an interruption, letting you upload the ones you choose to Sift once your connection returns.
* Watch live and recent telemetry with low latency from a local desktop app.
* Translate protocols on site, buffer telemetry, and replay it after reconnecting.
* Continue the analysis in Sift beside your Rules, Reports, saved views, and Run history.
 ## Compare every state change on one shared timeline
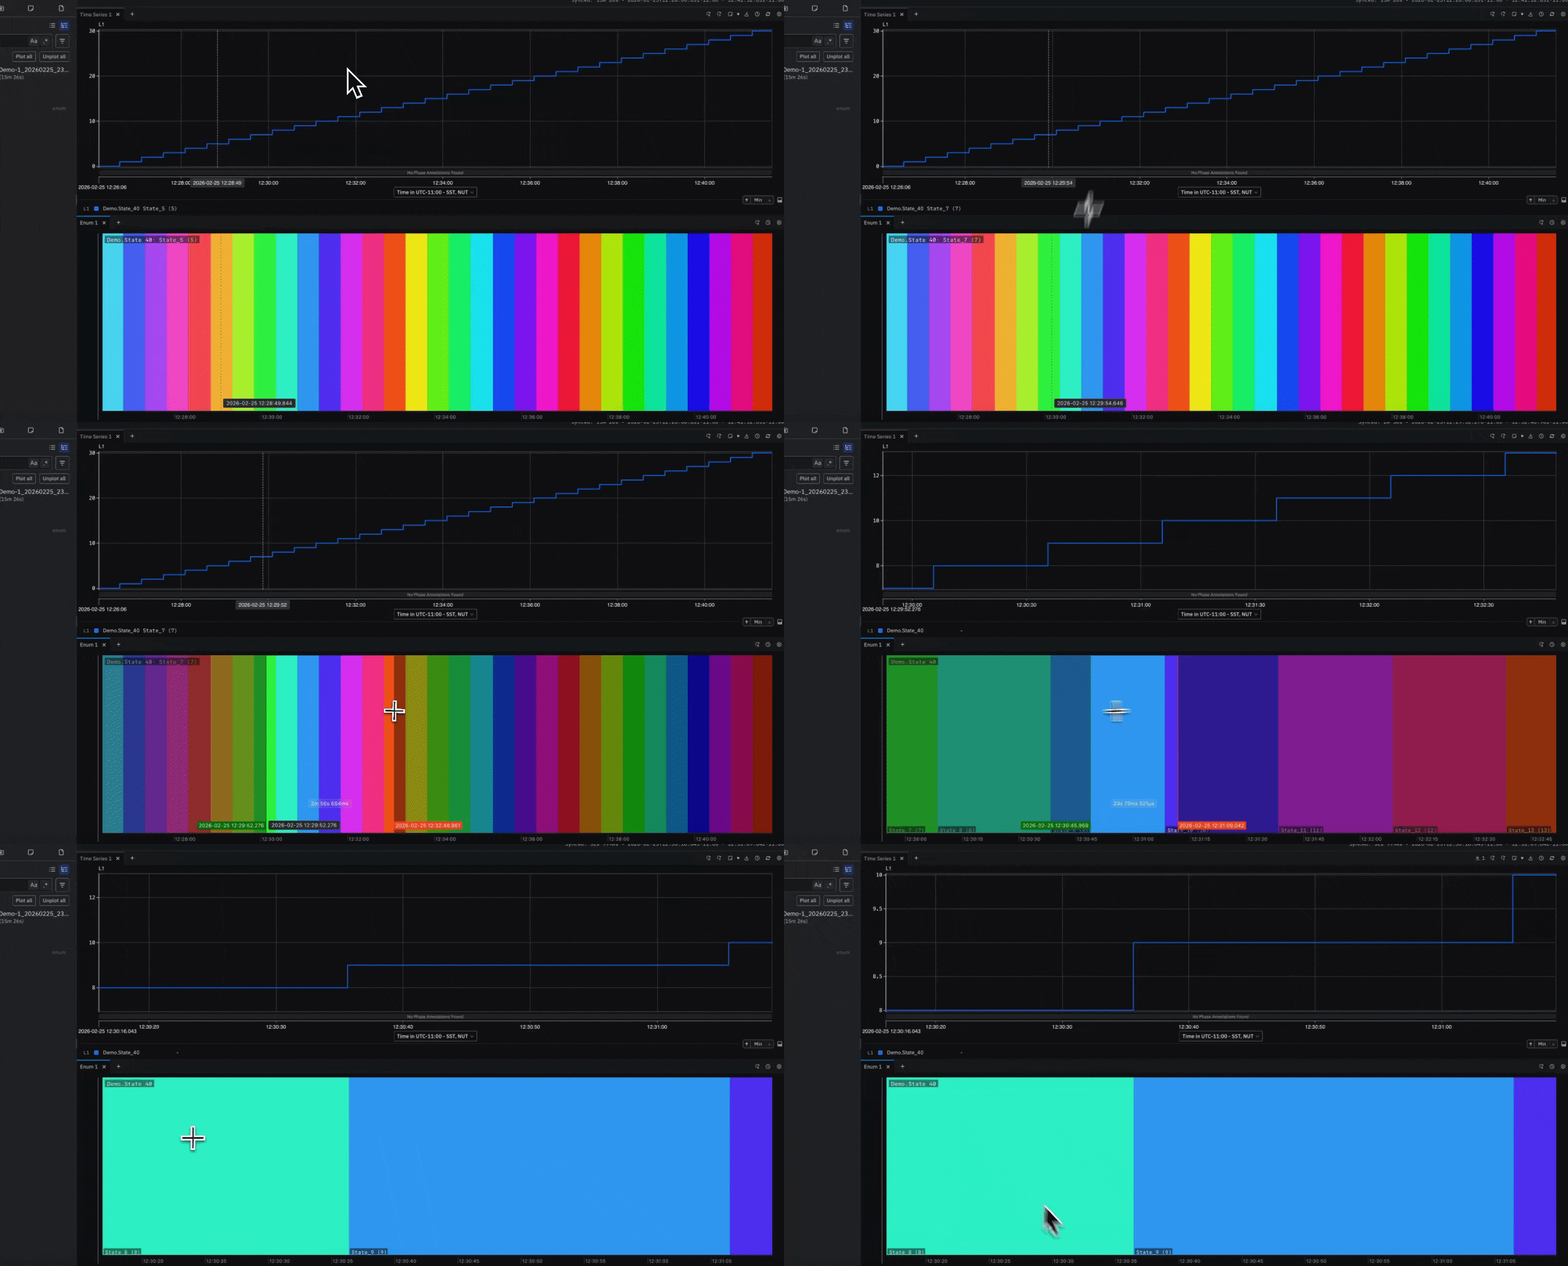
Plot enum and boolean Channels as labeled, color-coded periods with the [Enum Panel](/documentation/reference/explore-settings#panel-types). Give each Channel its own row so changes across the system stay aligned in time.
* Scan labeled bands to see how long each Channel held a state.
* Zoom into striped Multiple Values bands to resolve changes that share one pixel.
## Compare every state change on one shared timeline
Plot enum and boolean Channels as labeled, color-coded periods with the [Enum Panel](/documentation/reference/explore-settings#panel-types). Give each Channel its own row so changes across the system stay aligned in time.
* Scan labeled bands to see how long each Channel held a state.
* Zoom into striped Multiple Values bands to resolve changes that share one pixel.
 ## Track live values and scrub back through a test
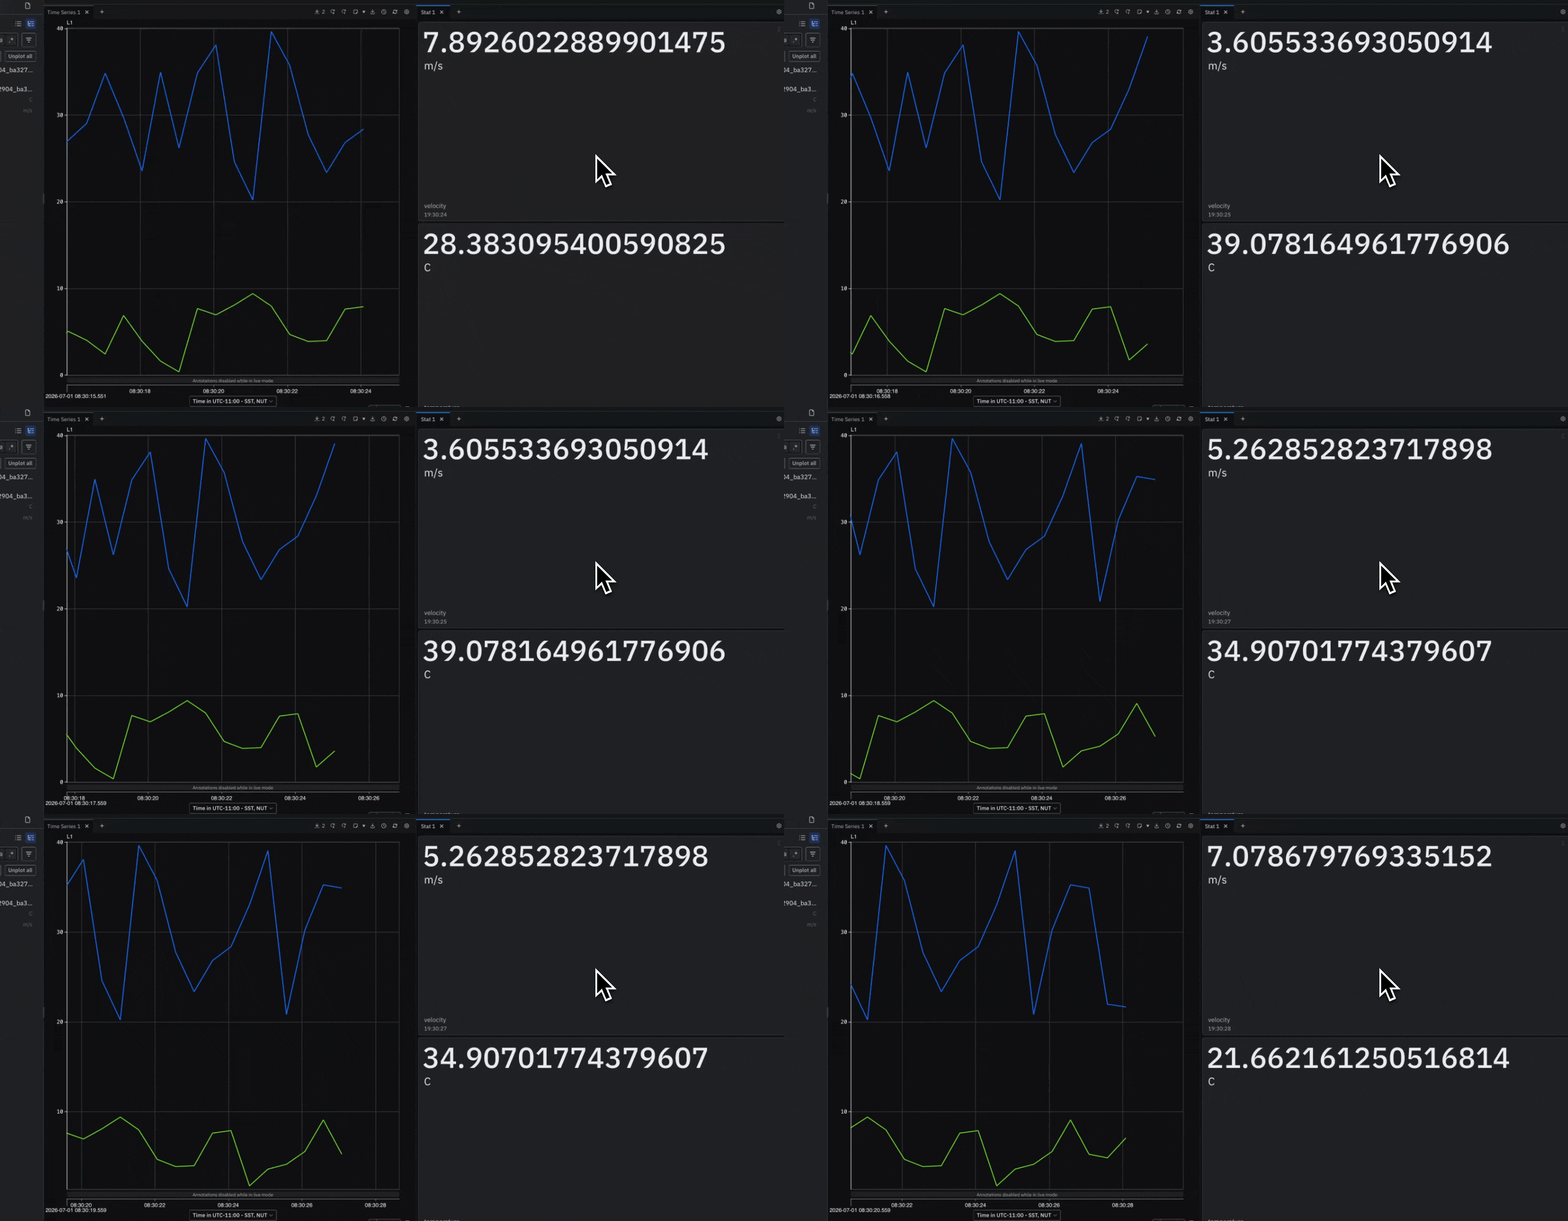
Display each Channel's latest value as a tile with the [Stat Panel](/documentation/reference/explore-settings#panel-types). Values update every second in Live mode and follow a shared time cursor during historical review.
* Sync with a Timeseries Panel to read values at the hovered or focused time.
* Look back up to 5 minutes to find the latest value for each Channel.
## Track live values and scrub back through a test
Display each Channel's latest value as a tile with the [Stat Panel](/documentation/reference/explore-settings#panel-types). Values update every second in Live mode and follow a shared time cursor during historical review.
* Sync with a Timeseries Panel to read values at the hovered or focused time.
* Look back up to 5 minutes to find the latest value for each Channel.
 ## Keep every review marker attached to its telemetry
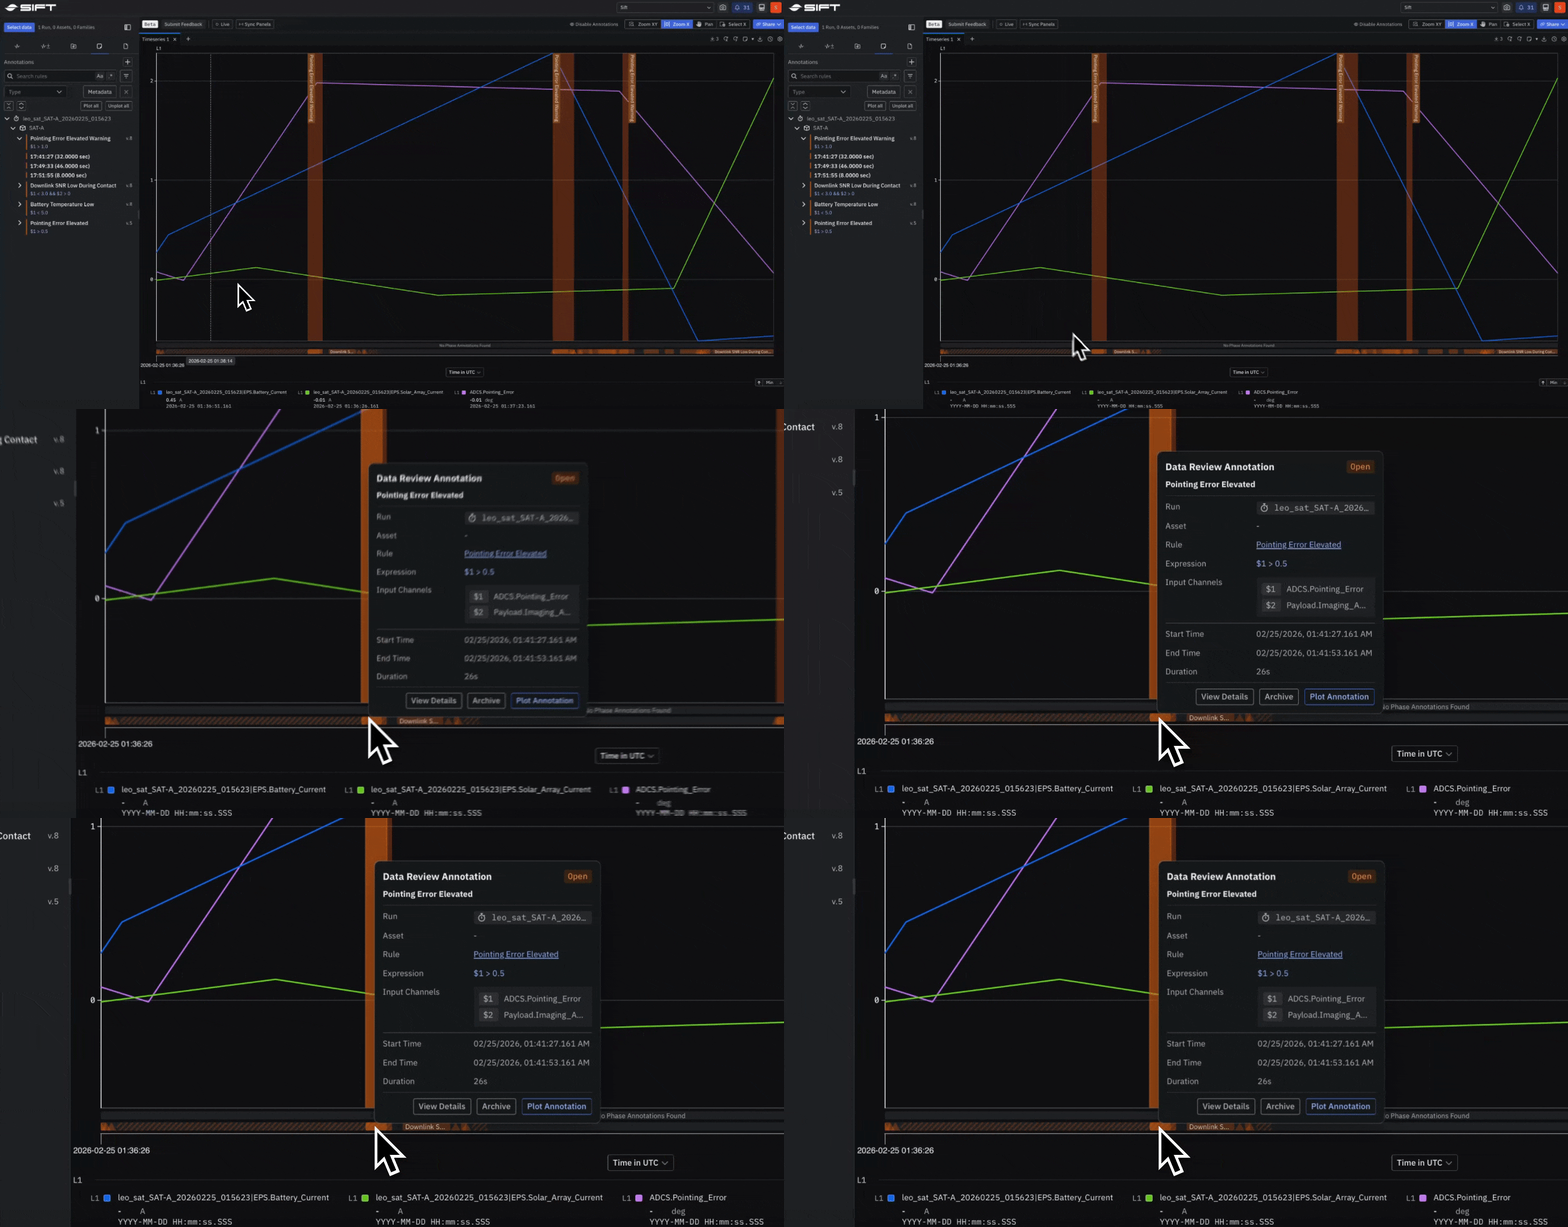
Mark a point or time range in a Run with [Annotations](/documentation/reference/explore-settings#annotations). Plot those markers on a Timeseries Panel or use one as the shared T-0 for Run comparison.
* Create an Annotation from the telemetry and time range you are reviewing.
* Align related Runs to the same event so behavior reads against one reference point.
## Keep every review marker attached to its telemetry
Mark a point or time range in a Run with [Annotations](/documentation/reference/explore-settings#annotations). Plot those markers on a Timeseries Panel or use one as the shared T-0 for Run comparison.
* Create an Annotation from the telemetry and time range you are reviewing.
* Align related Runs to the same event so behavior reads against one reference point.