> ## Documentation Index
> Fetch the complete documentation index at: https://docs.siftstack.com/llms.txt
> Use this file to discover all available pages before exploring further.
# Import ROS 2 logs, keep limits in view, and share Panel images
> Release notes · October 2026
Import ROS 2 recordings as MCAP files and start exploring their signals right away. Keep limits and time ranges visible as you work, then export a Panel image for reports and reviews.
## Import ROS 2 recordings in their native format
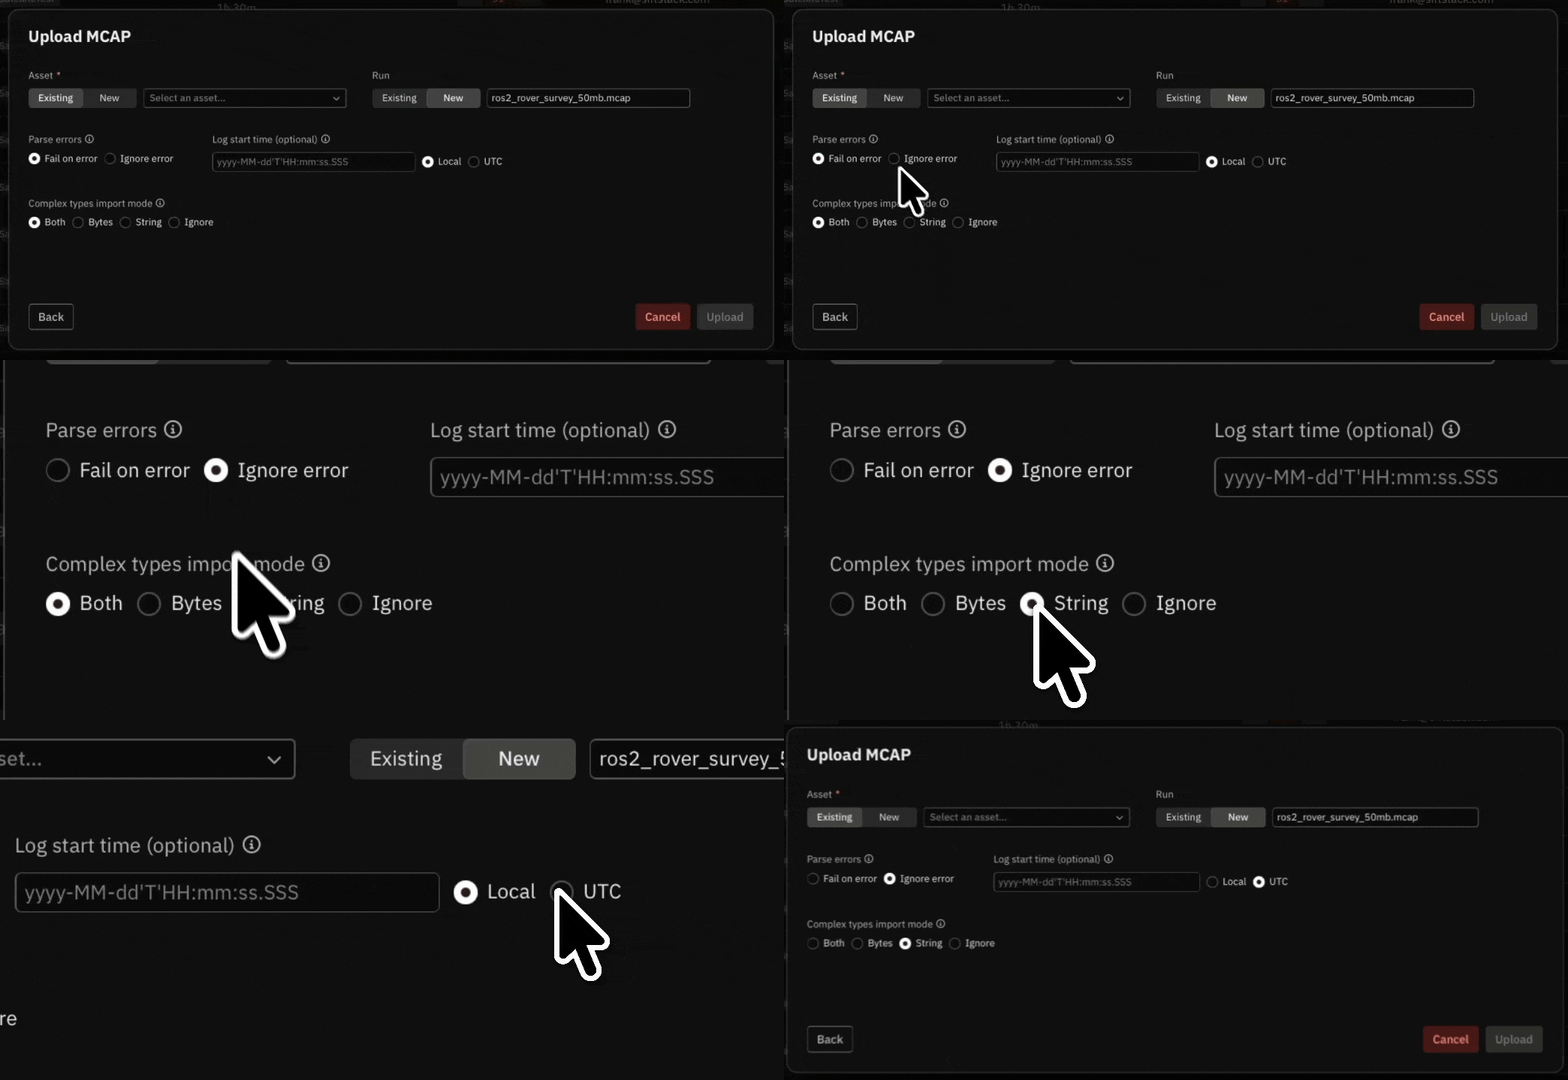
Bring `.mcap` files into Sift through the UI, API, Sift CLI, or Python client with [MCAP imports](/documentation/ingest/data-import/import-data-from-a-file). Each supported ROS 2 topic becomes a typed Channel inside the Run and Asset you choose.
* Set a start time for recordings that need clock alignment.
* Choose how to store point clouds, laser scans, and other complex fields.
* Skip unsupported topics and import the rest of the file.
 ## Keep redlines and targets in view
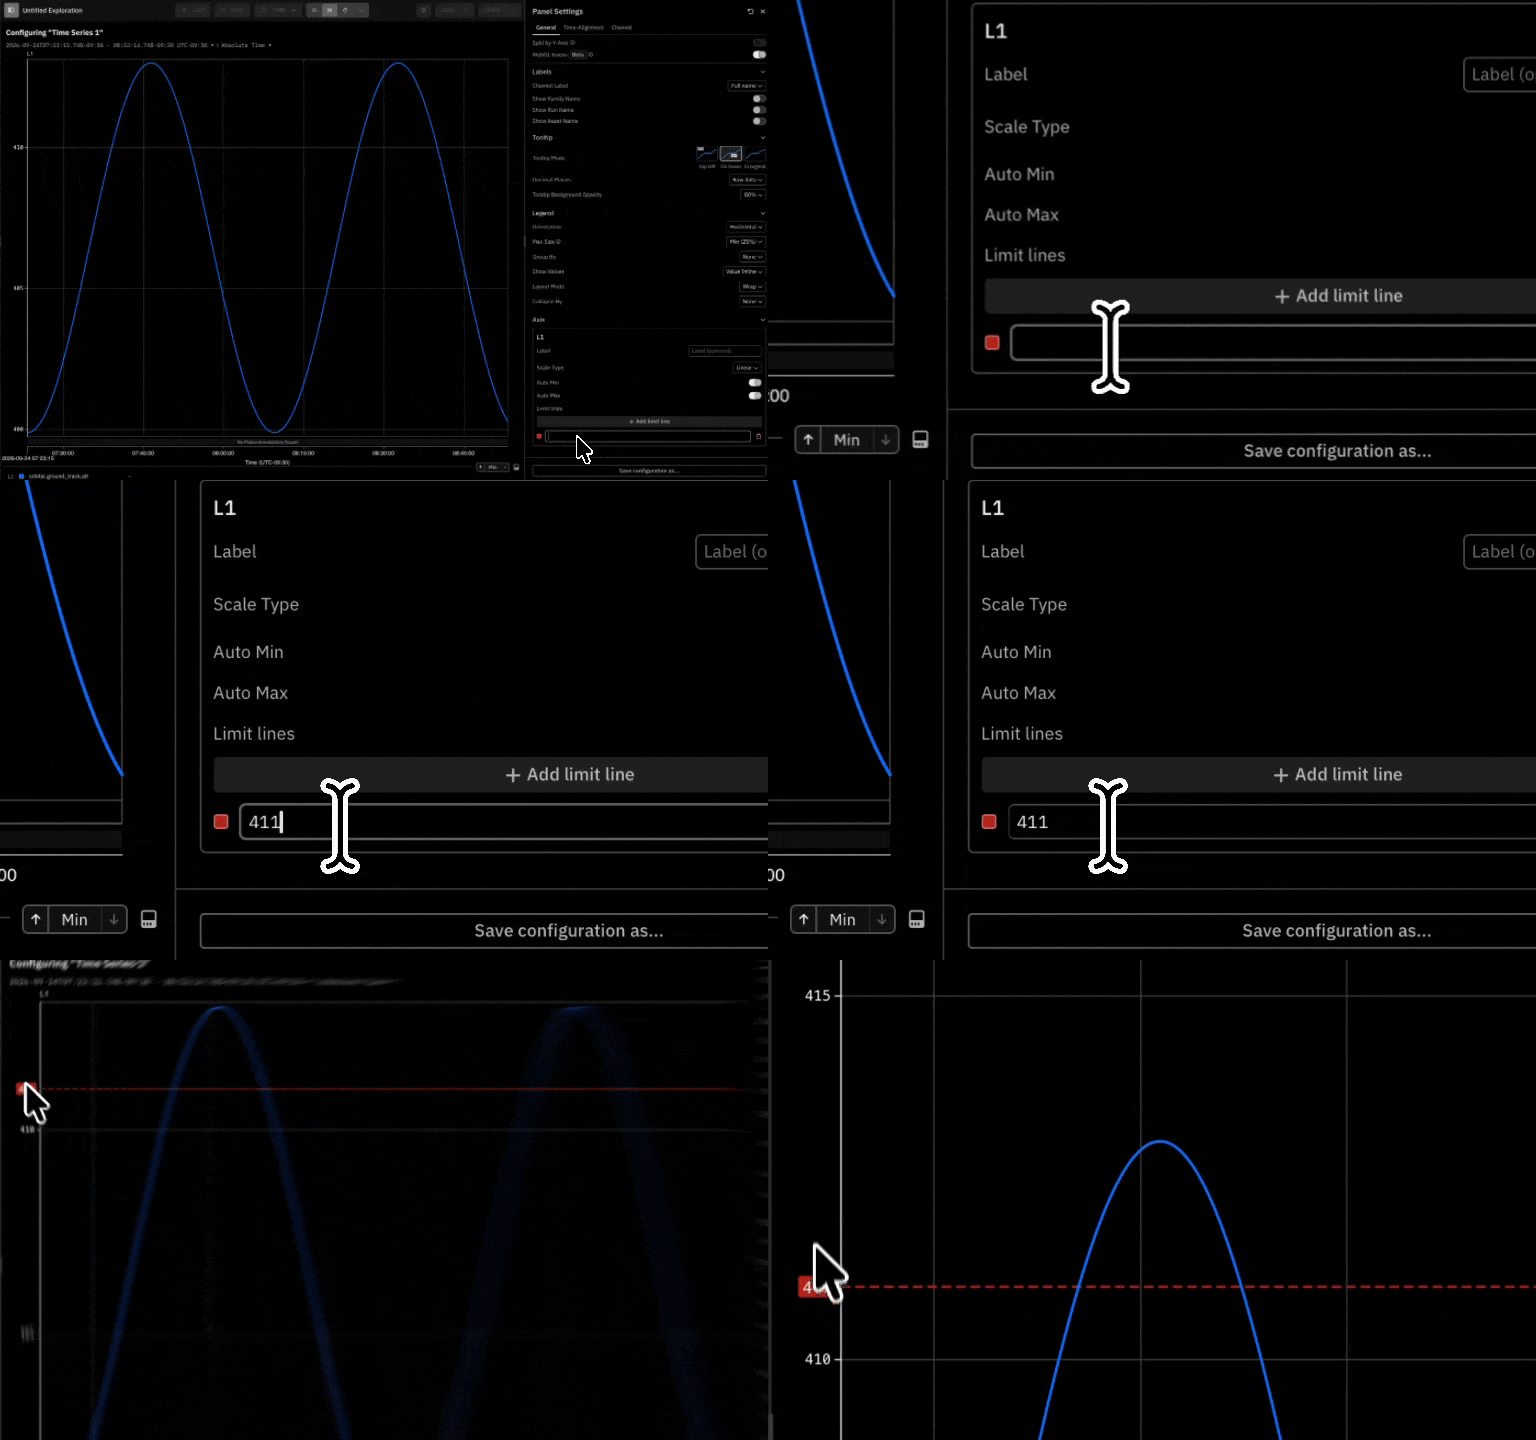
Mark important values on a Timeseries Panel with [Limit Lines](/documentation/reference/explore-settings#timeseries). Each line stays visible as you pan, zoom, save the Panel, or share it.
* Enter each limit once in Panel settings.
* Keep each line tied to the correct Y-axis.
## Keep redlines and targets in view
Mark important values on a Timeseries Panel with [Limit Lines](/documentation/reference/explore-settings#timeseries). Each line stays visible as you pan, zoom, save the Panel, or share it.
* Enter each limit once in Panel settings.
* Keep each line tied to the correct Y-axis.
 ## Stay oriented across every Panel
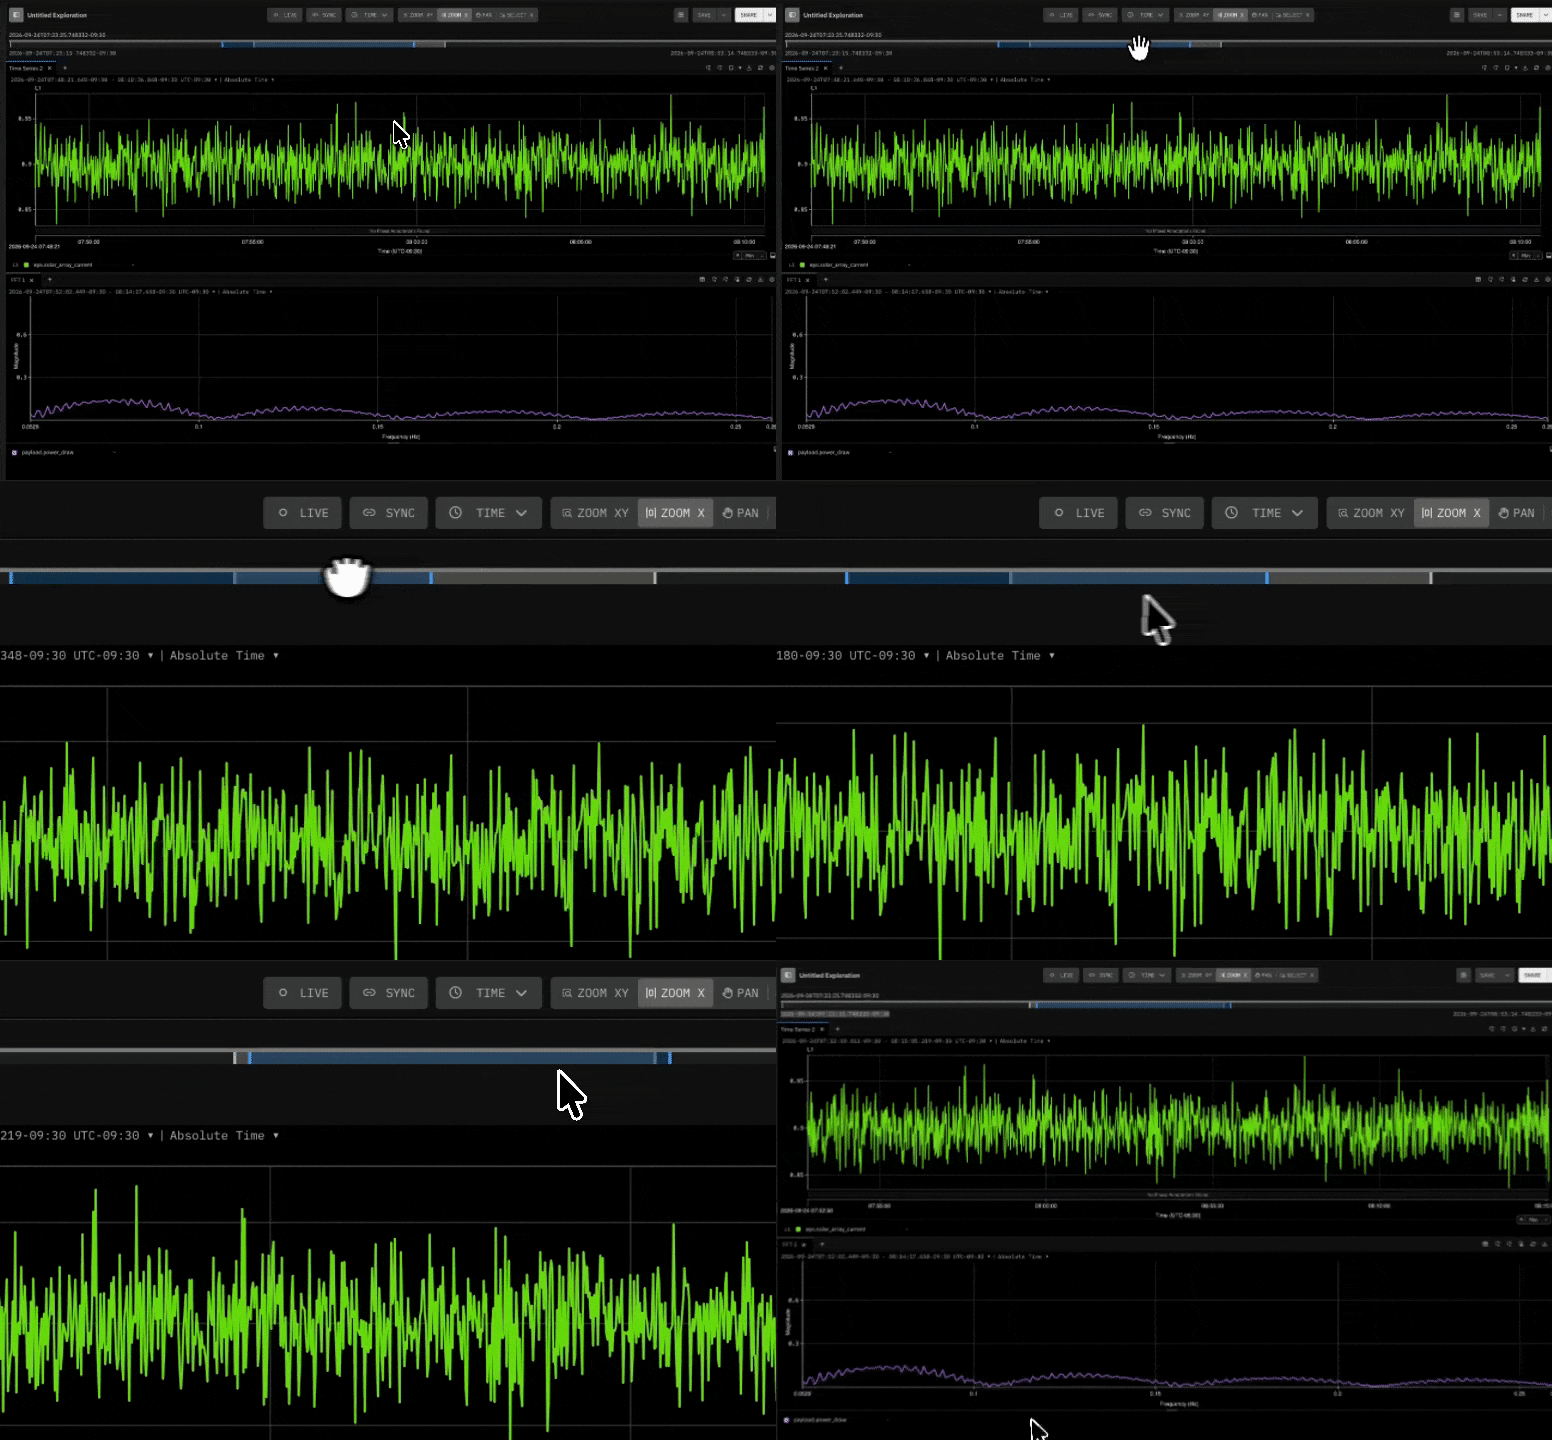
See where each Panel sits across the full test with the [Time Slider](/documentation/reference/explore-settings#time-slider). Drag its range to pan or zoom, or jump straight to another Panel.
* Set the full page range from the start and end times.
* Reset the view from the right-click menu.
## Stay oriented across every Panel
See where each Panel sits across the full test with the [Time Slider](/documentation/reference/explore-settings#time-slider). Drag its range to pan or zoom, or jump straight to another Panel.
* Set the full page range from the start and end times.
* Reset the view from the right-click menu.
 ## Carry any chart into your next review
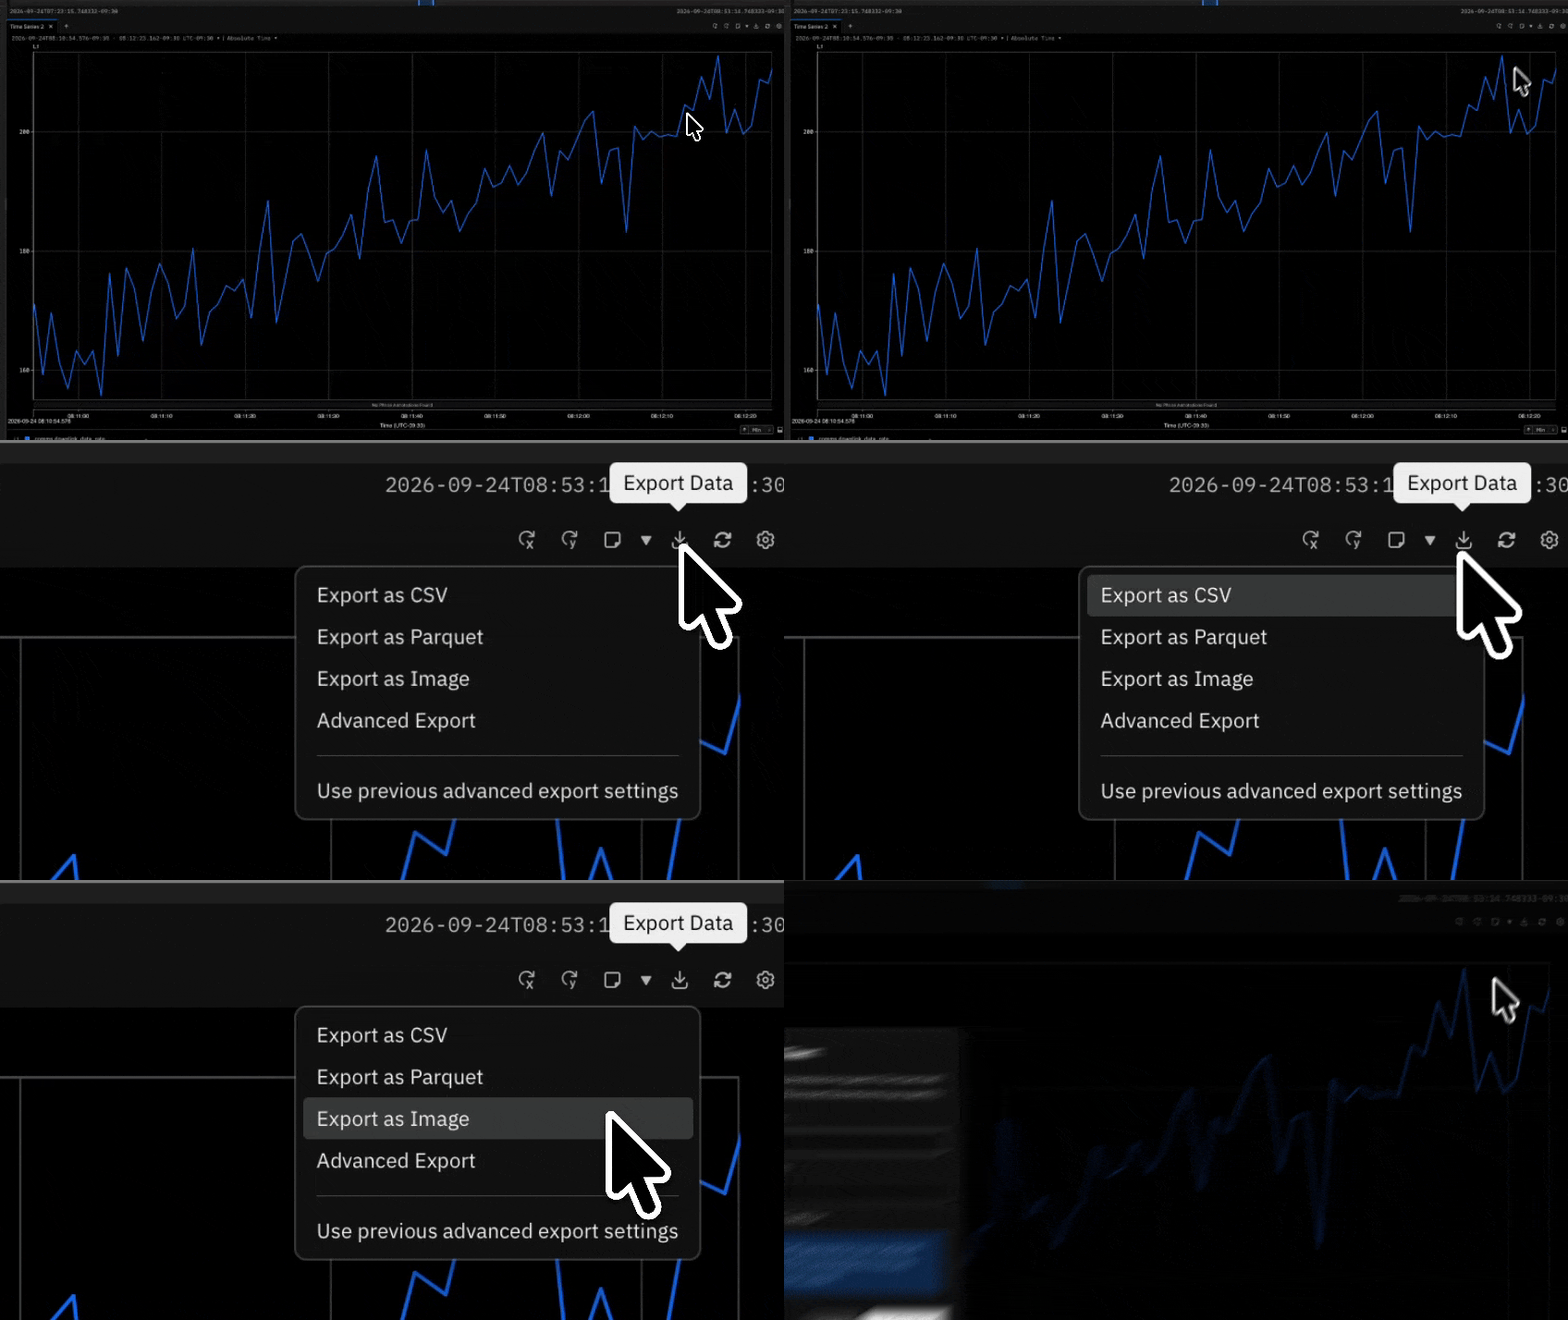
Save a Timeseries, FFT, Histogram, or Scatter Plot Panel as an image with [PNG export](/documentation/reference/explore-settings#export-data) in supported browsers. The file keeps the chart and legend as they appear in Explore.
* Choose Export as Image from the Panel toolbar.
* Keep working while the file saves in the background.
## Carry any chart into your next review
Save a Timeseries, FFT, Histogram, or Scatter Plot Panel as an image with [PNG export](/documentation/reference/explore-settings#export-data) in supported browsers. The file keeps the chart and legend as they appear in Explore.
* Choose Export as Image from the Panel toolbar.
* Keep working while the file saves in the background.