> ## Documentation Index
> Fetch the complete documentation index at: https://docs.siftstack.com/llms.txt
> Use this file to discover all available pages before exploring further.
# February 2026
> Scalable data analysis in context
This release makes Sift more capable and easier to use by helping engineers analyze telemetry in context. Teams can now calculate statistics over any time window, align signals with images and video, build reusable derived metrics, and navigate dense multi-axis data with greater precision, moving faster from raw signals to confident insight.
## Beta Measure your data over any time range
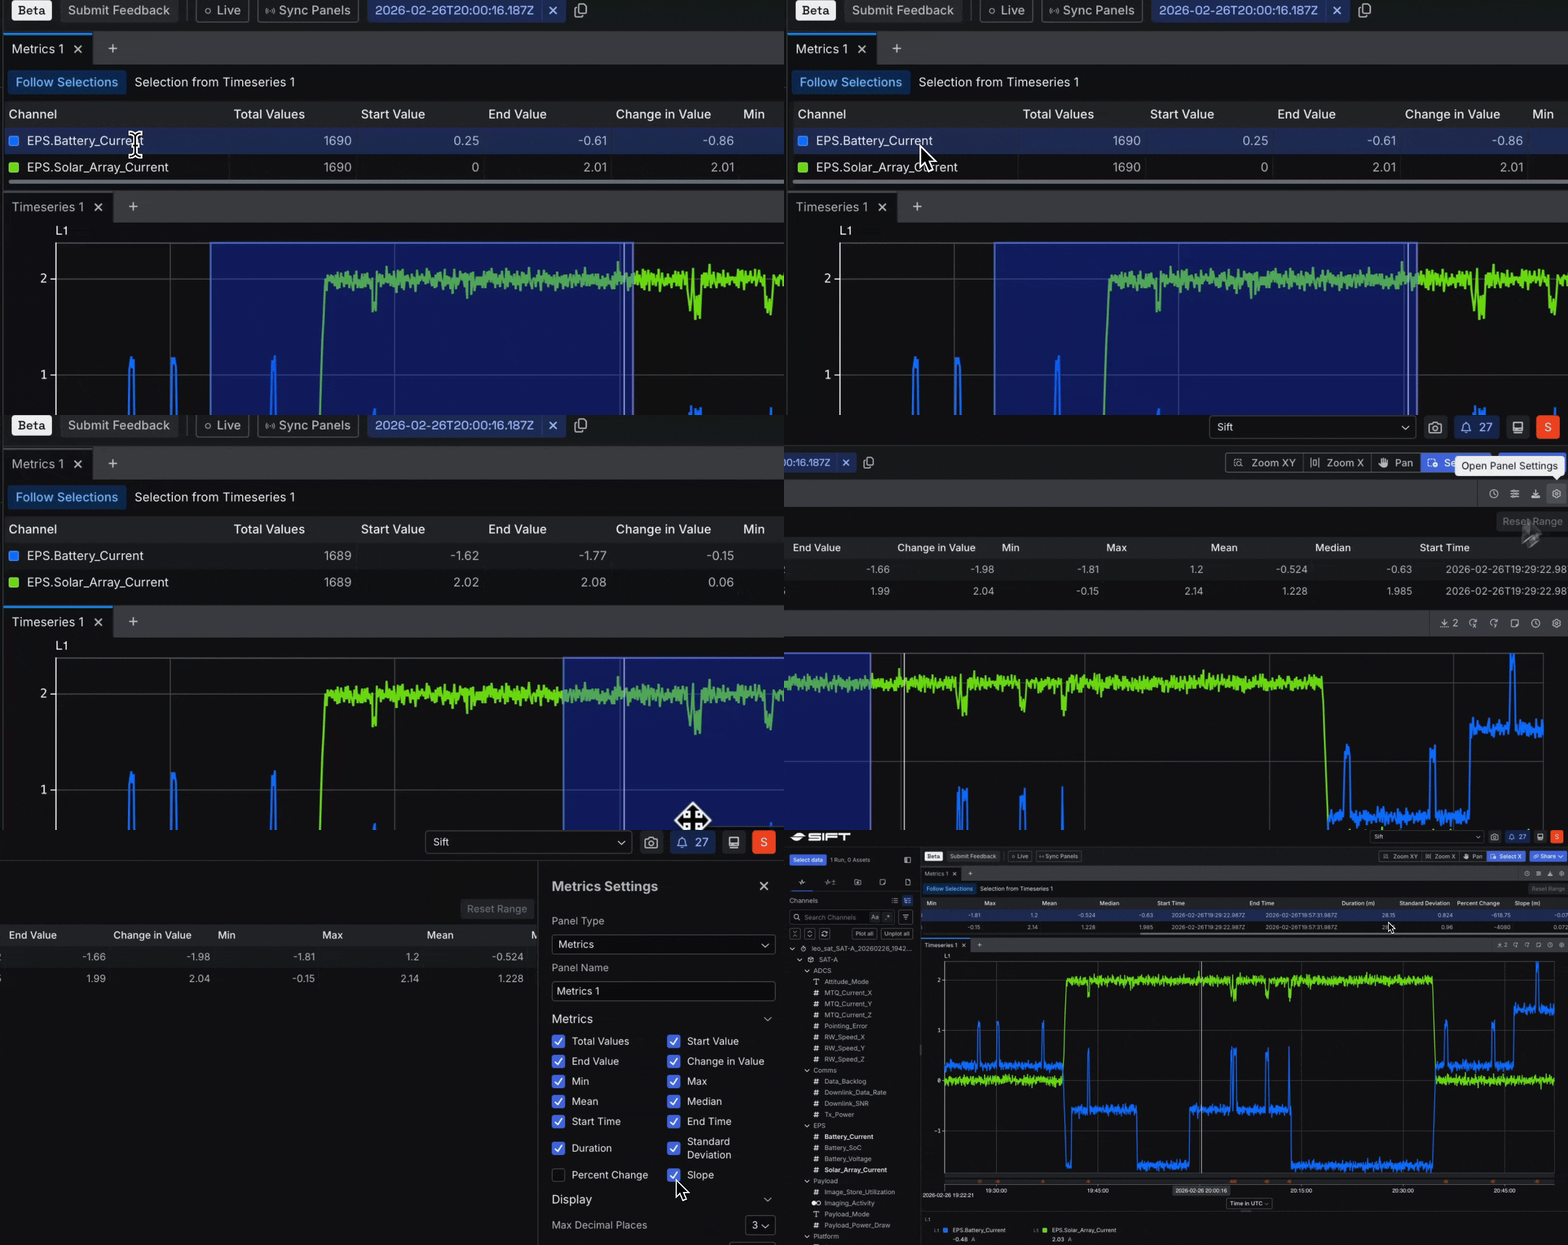
Select any section of your timeline in Explore v2 (Beta), and the Metrics Panel gives you the numbers: minimum, maximum, mean, and more. No need to export anything or switch tools.
* Pick a time range, and see stats for every signal in that window.
* Turn on "Follow selections" to update the numbers as you move through your data.
* Choose which stats you care about, lock a range for repeated checks, and export to CSV when you need a report.
 ## New Play back video, images, and audio synced to your telemetry
Explore critical moments with precise time alignment in Explore v2 (Beta) using the File Viewer Panel to correlate images, video, and audio with your telemetry data. Review media inline and anchor it directly to your data, enabling seamless movement between signal behavior and real world context within a single, unified view.
* Set a start timestamp for accurate time correlation,
* inspect images with built in zoom and pan, and
* stay oriented during playback with hover mirroring across Panels.
## New Play back video, images, and audio synced to your telemetry
Explore critical moments with precise time alignment in Explore v2 (Beta) using the File Viewer Panel to correlate images, video, and audio with your telemetry data. Review media inline and anchor it directly to your data, enabling seamless movement between signal behavior and real world context within a single, unified view.
* Set a start timestamp for accurate time correlation,
* inspect images with built in zoom and pan, and
* stay oriented during playback with hover mirroring across Panels.
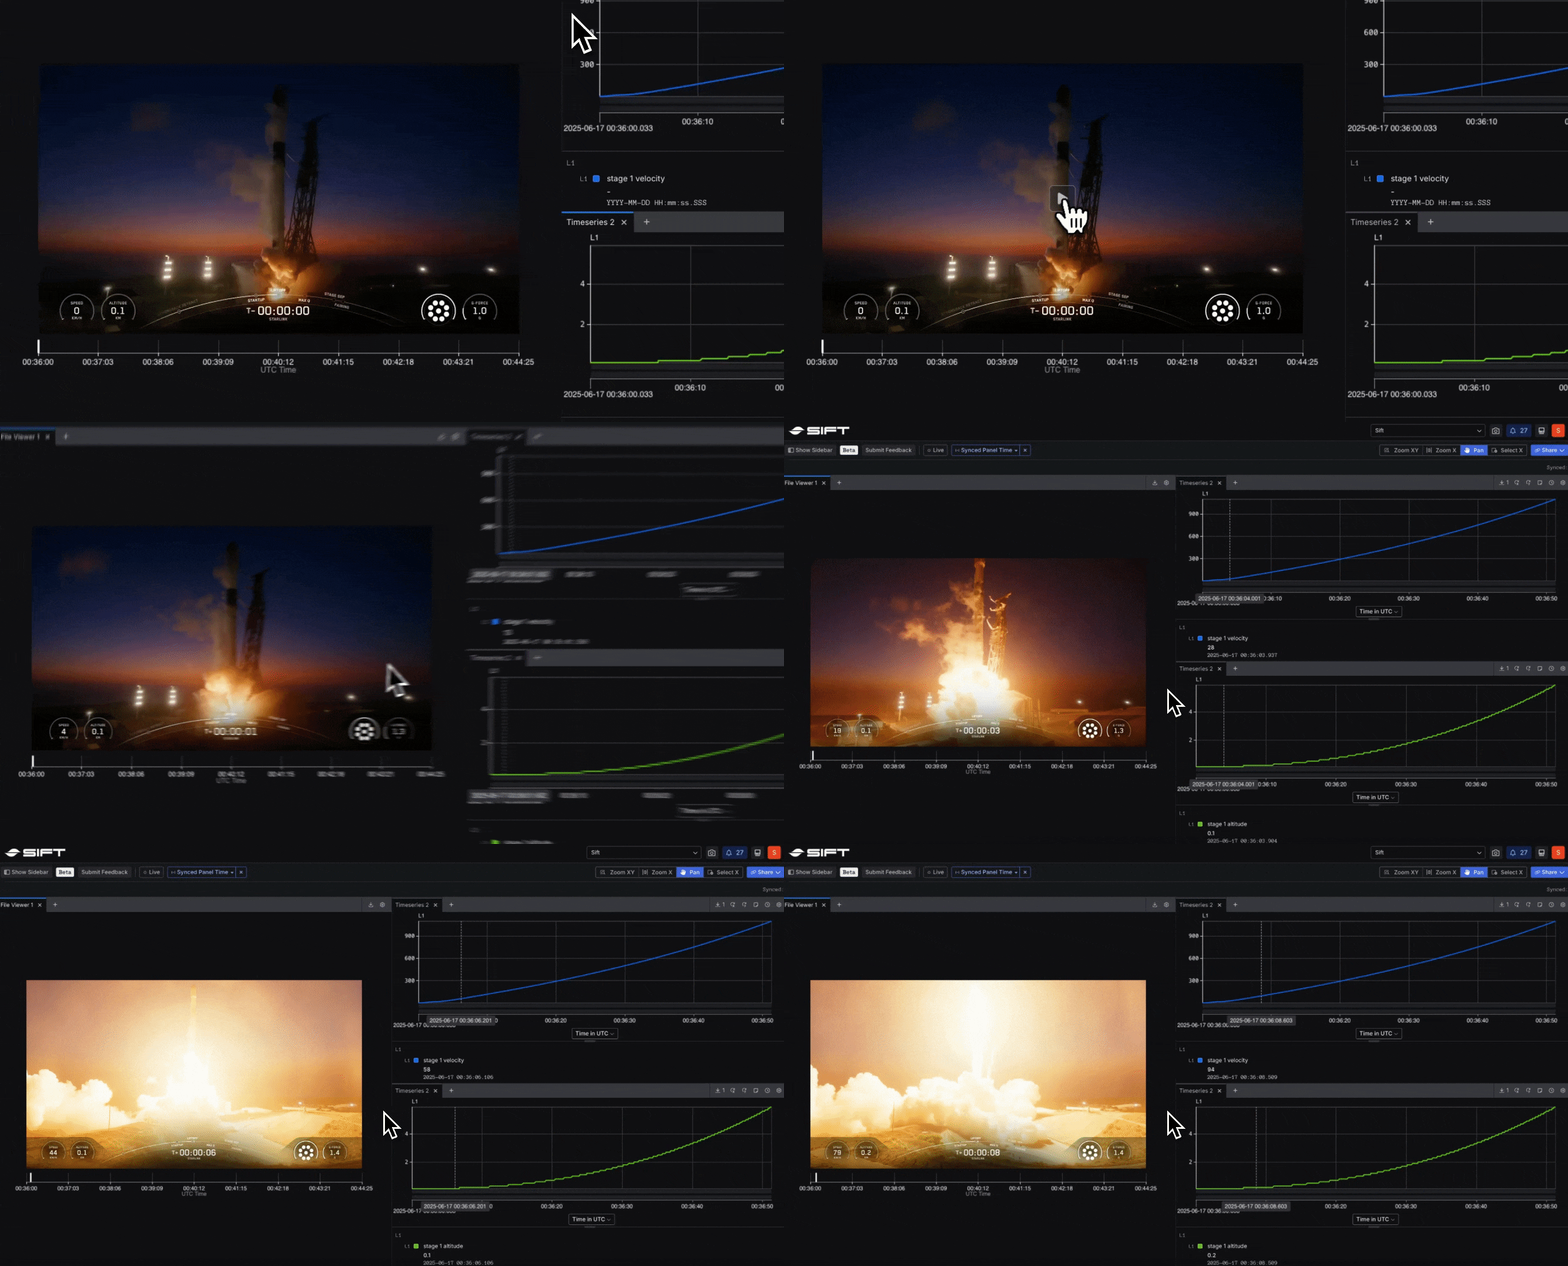
Video footage courtesy of SpaceX. Used here for educational and analytical purposes to demonstrate Sift's telemetry tools.
## Beta Reuse existing calculations to build new metrics, without starting from scratch
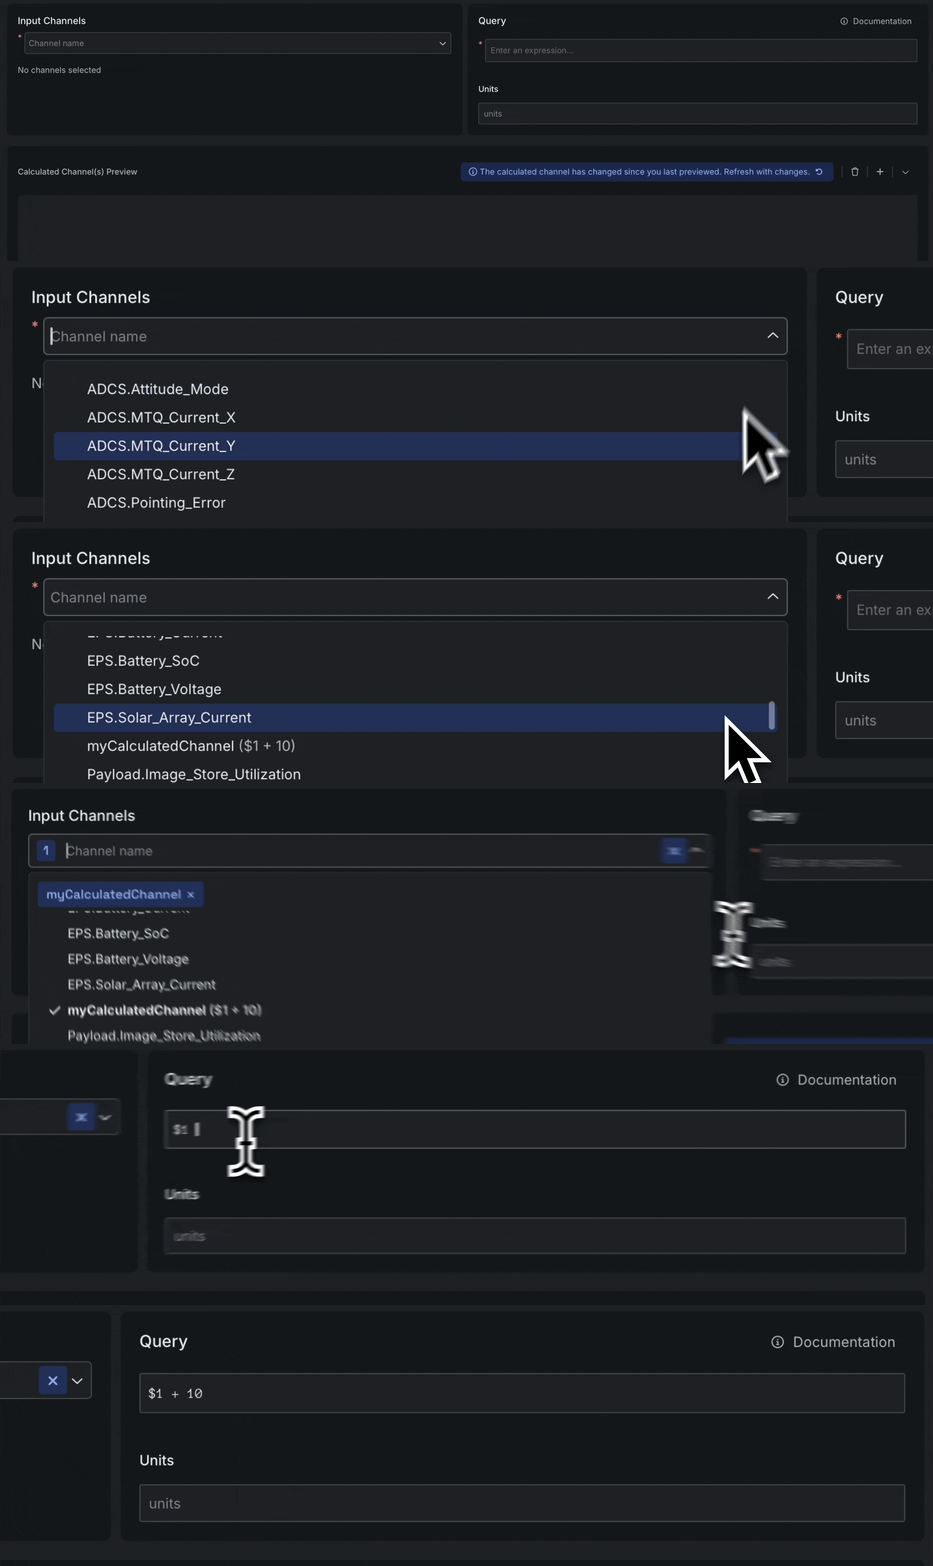
Build new calculations using Calculated Channels you've already created. Change one, and every metric that depends on it updates automatically.
* Edit one building block, and every metric that uses it stays up to date.
* Built-in validation catches circular references and missing inputs before they cause any issues.
* Dependency previews show you which calculations feed into which, so you can trace the logic at a glance.
 ## New Sort, group, and focus signals across up to eight axes
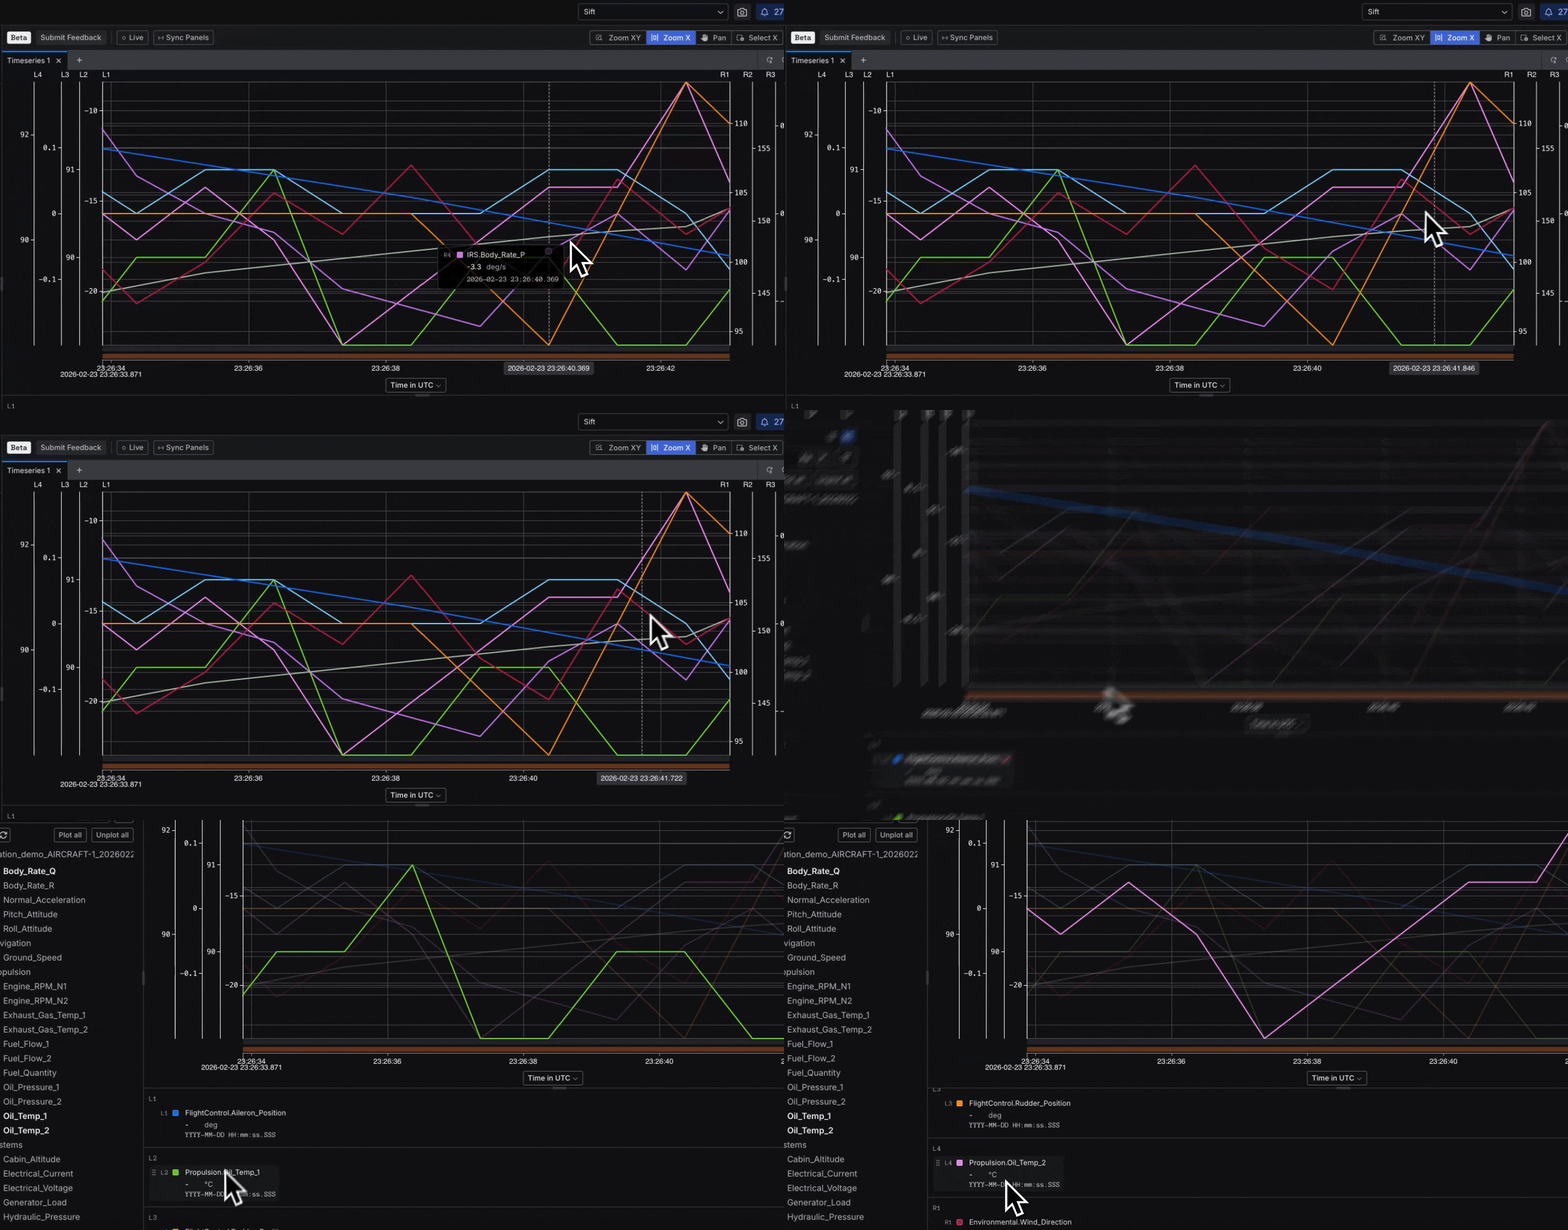
Organize busy charts and find the data that matters with new legend controls and focused tooltips in Explore v2 (Beta). Drag signals between axes, group them by type or source, and hover to highlight what you care about. Add up to eight independent axes to the Timeseries Panel and cut through visual noise. Tooltips now show only the nearest data point.
* Drag signals between axes to compare them side by side.
* Group legend items by data source, type, or units.
* Hover over a trace to highlight it and dim everything else.
## New Sort, group, and focus signals across up to eight axes
Organize busy charts and find the data that matters with new legend controls and focused tooltips in Explore v2 (Beta). Drag signals between axes, group them by type or source, and hover to highlight what you care about. Add up to eight independent axes to the Timeseries Panel and cut through visual noise. Tooltips now show only the nearest data point.
* Drag signals between axes to compare them side by side.
* Group legend items by data source, type, or units.
* Hover over a trace to highlight it and dim everything else.